
Allison Transmission Expands Off-Highway Portfolio While Managing Margin Pressure and Supply Risks
The company’s 2025 results reflect strategic diversification via acquisition amid macroeconomic and operational headwinds.
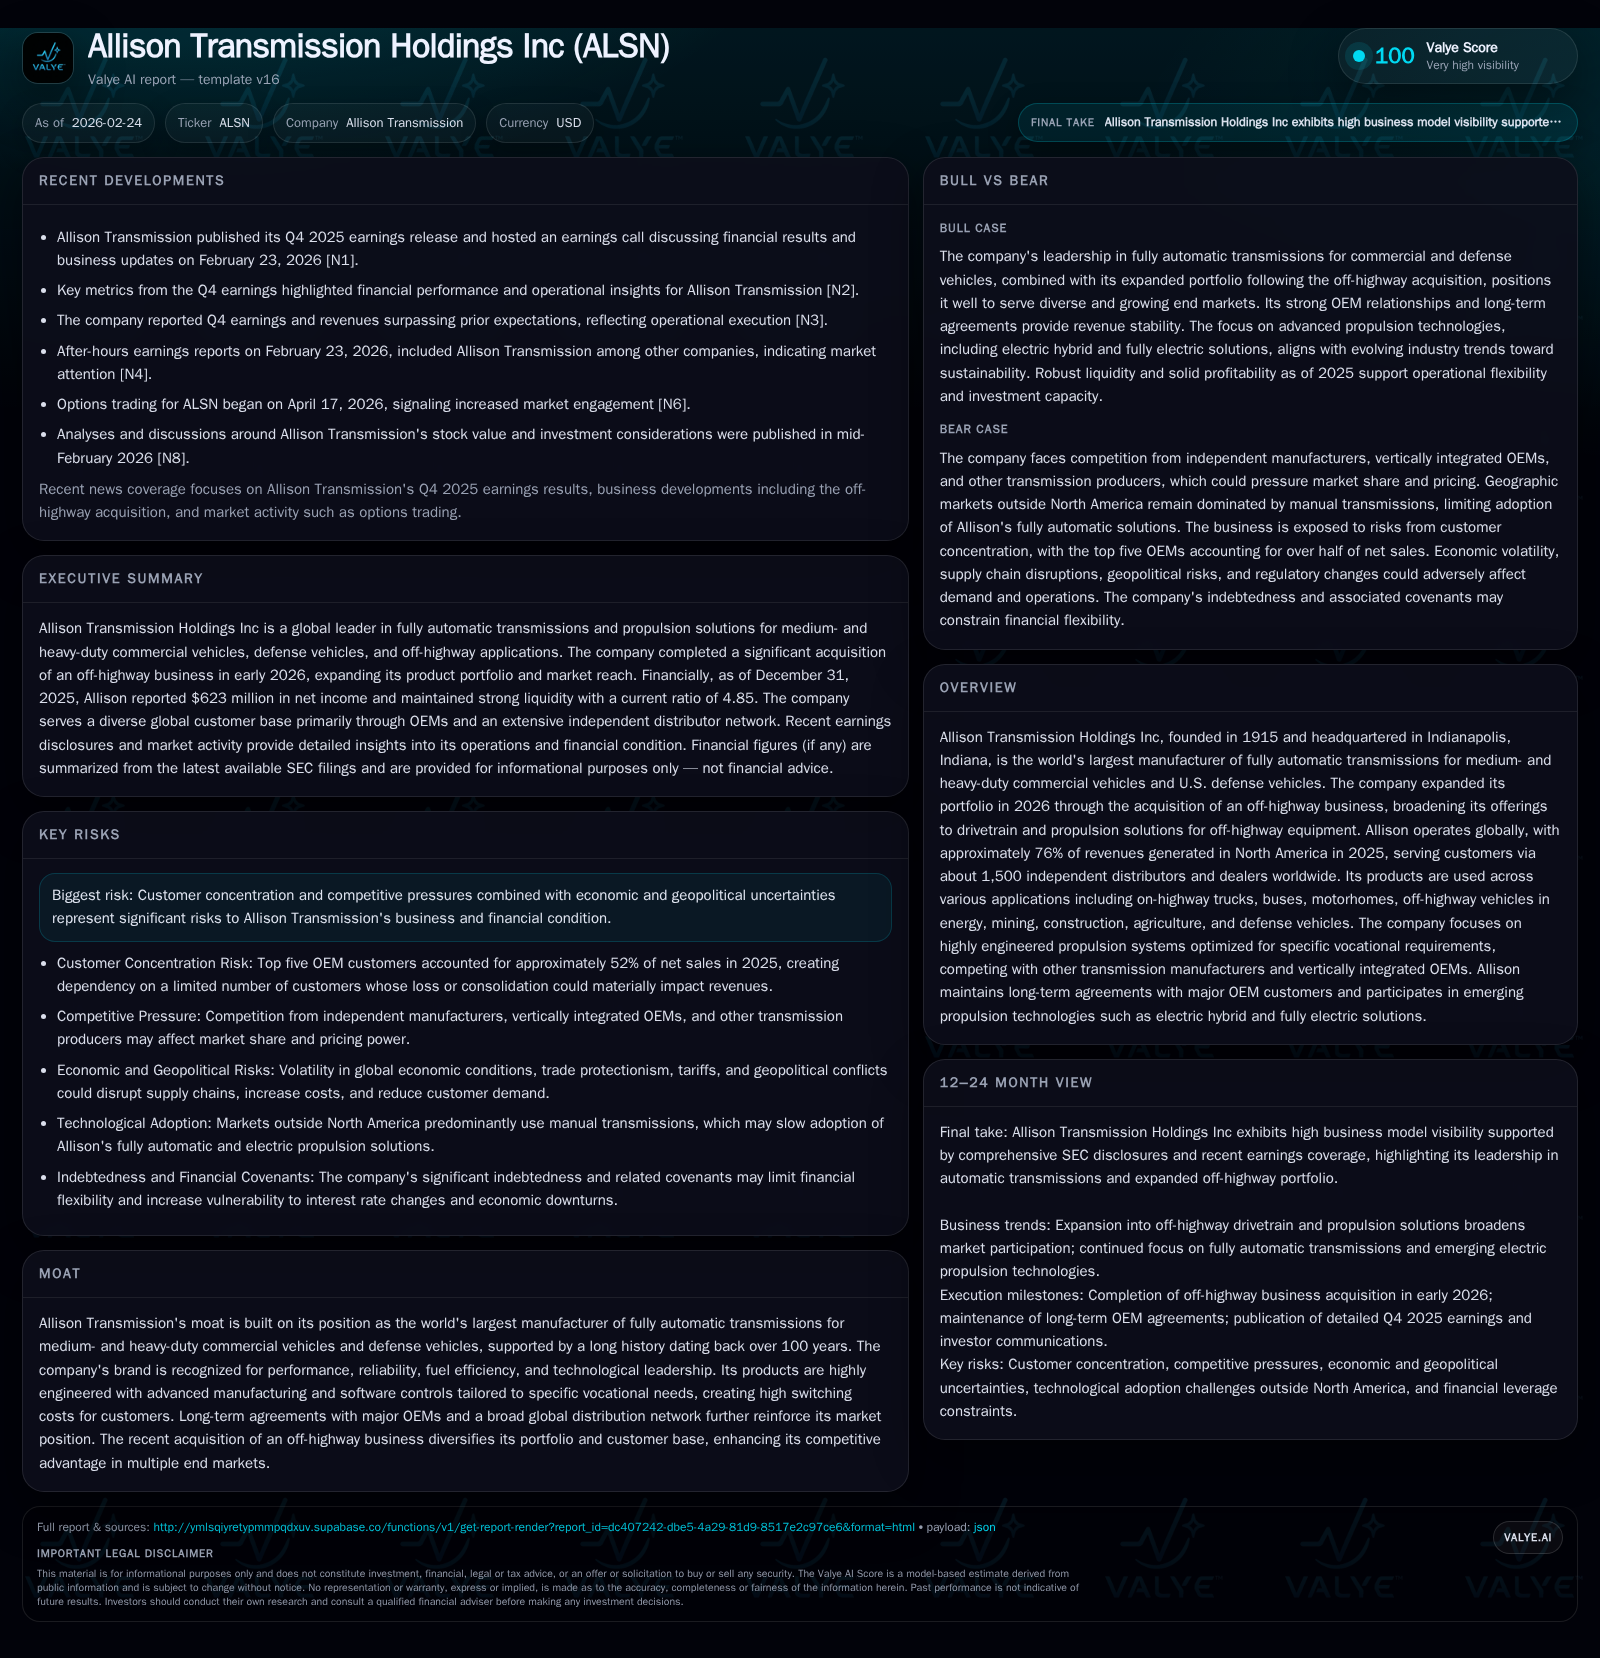
Allison Transmission Holdings Inc remains the global leader in fully automatic transmissions for medium- to heavy-duty commercial and defense vehicles, with a history stretching back over 100 years. In 2025, the company saw a decline in operating income and net income compared to prior years, influenced by inflationary pressures, supply chain disruptions, and economic cyclicality. The January 2026 acquisition of an off-highway drivetrain business broadens Allison’s product scope into energy, mining, construction, and agriculture sectors. While this diversification could bolster longer-term growth, margin expansion remains challenged by raw material cost volatility and competitive pressures. Allison’s strong operating cash flow and disciplined capital allocation support investments and shareholder returns, but leverage dynamics warrant ongoing attention.
Company Overview and Industry Position
Allison Transmission Holdings Inc (ALSN) is the world’s largest manufacturer of fully automatic transmissions for medium- and heavy-duty commercial vehicles as well as U.S. defense platforms. Founded in 1915 and headquartered in Indianapolis, Indiana, Allison commands a notable moat based on brand recognition for technological leadership, reliability, fuel efficiency, and highly engineered vocational propulsion systems tailored to customer needs [S21]/[S27]. The company distributes products globally through roughly 1,500 independent dealers yet channels nearly three-quarters of its revenues from North America [S21].
In January 2026, Allison strategically expanded its portfolio by acquiring an off-highway drivetrain business targeting equipment for energy extraction (including hydraulic fracturing rigs), mining trucks (with payloads from 40 to 130 tons), construction vehicles, agriculture machinery, and specialty defense applications [S21]/[S27]/[S16]. This acquisition diversifies revenue streams beyond traditional on-highway commercial vehicles where Allison has dominated for decades.
Historical Financial Performance
Though full revenue details are not publicly tagged by the company as of the latest filings, Allison’s profitability metrics over the past four fiscal years illustrate a challenging but resilient profile:
Historical performance (annual)
| FY | Net ($mm) | CFO ($mm) | OpInc ($mm) | Capex ($mm) | Net YoY |
|---|---|---|---|---|---|
| 2025 | 623 | 836 | 880 | 175 | -14.8% |
| 2024 | 731 | 801 | 992 | 143 | +8.6% |
| 2023 | 673 | 784 | 919 | 125 | +26.7% |
| 2022 | 531 | 657 | 784 | 167 |
Note: Omitted columns lack sufficient annual XBRL coverage in the provided tags (need ≥2 annual points): Rev. Source: SEC companyfacts cache [F1].
Capital returns and efficiency (annual)
| FY | Div ($mm) | Buybacks ($mm) | FCF ($mm) |
|---|---|---|---|
| 2025 | 91 | 328 | 661 |
| 2024 | 87 | 254 | 658 |
| 2023 | 83 | 263 | 659 |
| 2022 | 80 | 278 | 490 |
Source: SEC companyfacts cache [F1].
*Note: Revenue data is not available in provided tags; YoY percentages are calculated from available net income and operating income figures [F1].
Operating income peaked in FY24 before declining by over one-tenth (-11.3%) in FY25. Net income declined more sharply (-14.8%), indicating margin pressures likely linked to inflationary cost increases and supply-side constraints [F1]. Operating cash flow remained robust at $836 million (+4.4% YoY), supporting increased capital expenditures (+22.4%) for capacity expansion and technology development.
Business Segments & Market Exposure
Post-acquisition operations are organized into two primary units: On-Highway Transmissions — servicing Class 4-8 vocational trucks, buses (school/transit/coach), motorhomes; Off-Highway Drive & Motion Systems — serving energy sector equipment (hydraulic fracturing pumps), mining trucks (rigid/wide-body dump trucks), construction machinery, agricultural equipment, specialty vehicles including wheeled defense platforms [S6]/[S16]/[S27].
Long-term agreements (typically three to five years) with top OEM customers—accounting for about half of total sales—provide revenue stability but concentrate risk [S5]. The top three OEMs—Daimler AG (18%), PACCAR Inc. (11%), Traton SE (10%)—accounted for nearly four-tenths of net sales in FY25 alone [S5]. Loss or model discontinuation at any key OEM could materially impact financial performance.
International markets outside North America constitute about one-quarter of revenues with varying transmission technology adoption rates; manual transmissions remain predominant in many Asian and South American markets while Europe exhibits strong vertical integration among OEMs [S23]/[S27]. Fully automatic transmission penetration outside North America is limited but growing.
Competitive Landscape
On-highway competition includes manual transmission manufacturers developing automated manual transmissions (AMTs), electric propulsion providers like BAE Systems plc in transit markets, vertically integrated OEM powertrain producers (e.g., Ford Motor Company, ZF Friedrichshafen AG), as well as Driventic GmbH [S7]. Off-highway end markets feature competitors such as Caterpillar Inc., Komatsu Ltd., Volvo Group alongside specialized suppliers including Twin Disc [S16]. Allison leverages its longstanding expertise plus software-controlled advanced systems tailored to vocational needs.
Growth Prospects & Constraints
The recent acquisition offers growth potential by entering complementary off-highway segments characterized by distinct demand cycles relative to on-highway trucking fleets [N1]/[S21]/[S27]. Energy sector activity—including hydraulic fracturing—is sensitive to commodity price dynamics but remains sizable for high-torque fully automatic transmissions.
Electrification trends push Allison toward hybrid electric solutions especially within transit bus operations where emissions regulations tighten [S7]/[S28]. R&D efforts remain critical amid evolving propulsion technologies though adoption timelines may span multiple fleet buying cycles affecting near-term results [S28].
Macro risks include cyclical end-user demand variability; raw material inflation impacting costs notably steel/aluminum/nickel price volatility with lagged customer pricing pass-through [S20]; labor inflation combined with significant union representation (~43% employees under UAW contracts through Nov ’27) influencing wage expenses [S5]; geopolitical tensions causing supply chain interruptions or regional demand shocks given suspended sales activities in Russia/Belarus [S14]; plus intensified regulatory burdens around environmental compliance potentially raising manufacturing costs [S8]/[S9].
Capital Allocation & Financial Health
At FY25 end, Allison held approximately $1.495 billion in cash equivalents against current liabilities of $460 million yielding a strong current ratio (~4.85x), indicative of prudent liquidity management amid uncertainties [F1]. Shareholders’ equity rose markedly over recent years reaching nearly $1.87 billion driven by retained earnings despite net income declines.
Debt levels remain substantial with approximately $2.9 billion total indebtedness reported at December ’25; credit agreements amended early ’26 added incremental term loans totaling $1.2 billion plus increased revolving credit commitments by $250 million supporting acquisition financing [S24]/[S12].
Free cash flow approximated $661 million after capital expenditures supported ongoing R&D alongside steady dividends (~$91 million FY25) and robust buybacks ($328 million FY25), signaling disciplined capital deployment despite margin pressures last year [F1].
Monitoring Points & Analyst Considerations
Absent explicit forward guidance beyond milestone acquisition integration completed Jan ’26 referenced in recent earnings commentary [N1]/[N3], investors should monitor:
- Successful integration of off-highway acquisition including synergy realization via cross-selling or production efficiencies.
- Margin recovery trajectory amidst raw material cost volatility balanced against sustainable pricing within LTAs.
- Evolution of R&D pipeline particularly adoption rates for hybrid/electric propulsion solutions.
- Impacts from geopolitical events or labor relations developments affecting production or market access.
- Leverage management effectiveness given sizeable debt relative to operating income generation.
Conclusion
Allison Transmission holds an entrenched leadership position supported by technological mastery over fully automatic transmissions for key commercial vehicle vocations now broadened across diverse off-highway equipment markets via recent acquisitions. Despite near-term earnings pressure largely due to inflationary input costs amid complex macroeconomic conditions—including supplier concentration risks—the company’s sturdy cash flow supports disciplined capital allocation including dividends and share repurchases aligned with shareholder return priorities.
Future success hinges on efficient assimilation of newly acquired businesses alongside sustained innovation capturing emerging propulsion technologies while navigating cyclical industry dynamics plus geopolitical/regulatory challenges shaping global supply-demand balances. Continued engagement across major OEM networks offers enduring competitive advantages given high switching costs inherent within vocationally optimized propulsion frameworks developed over decades.
This analysis is based on publicly available data including recent SEC filings dated February ’26 and contemporary earnings disclosures cited without providing investment recommendations.
Disclaimer: This is research-only, informational analysis and not investment advice. It may include AI-generated interpretation and general industry context. Always verify important details using primary sources.
Comments