
AutoNation’s Q1 2026 Shows Stable Finance Income Amid Vehicle Sales Pressure
AutoNation navigates mixed vehicle demand while leveraging finance operations and brand scale to sustain margins.
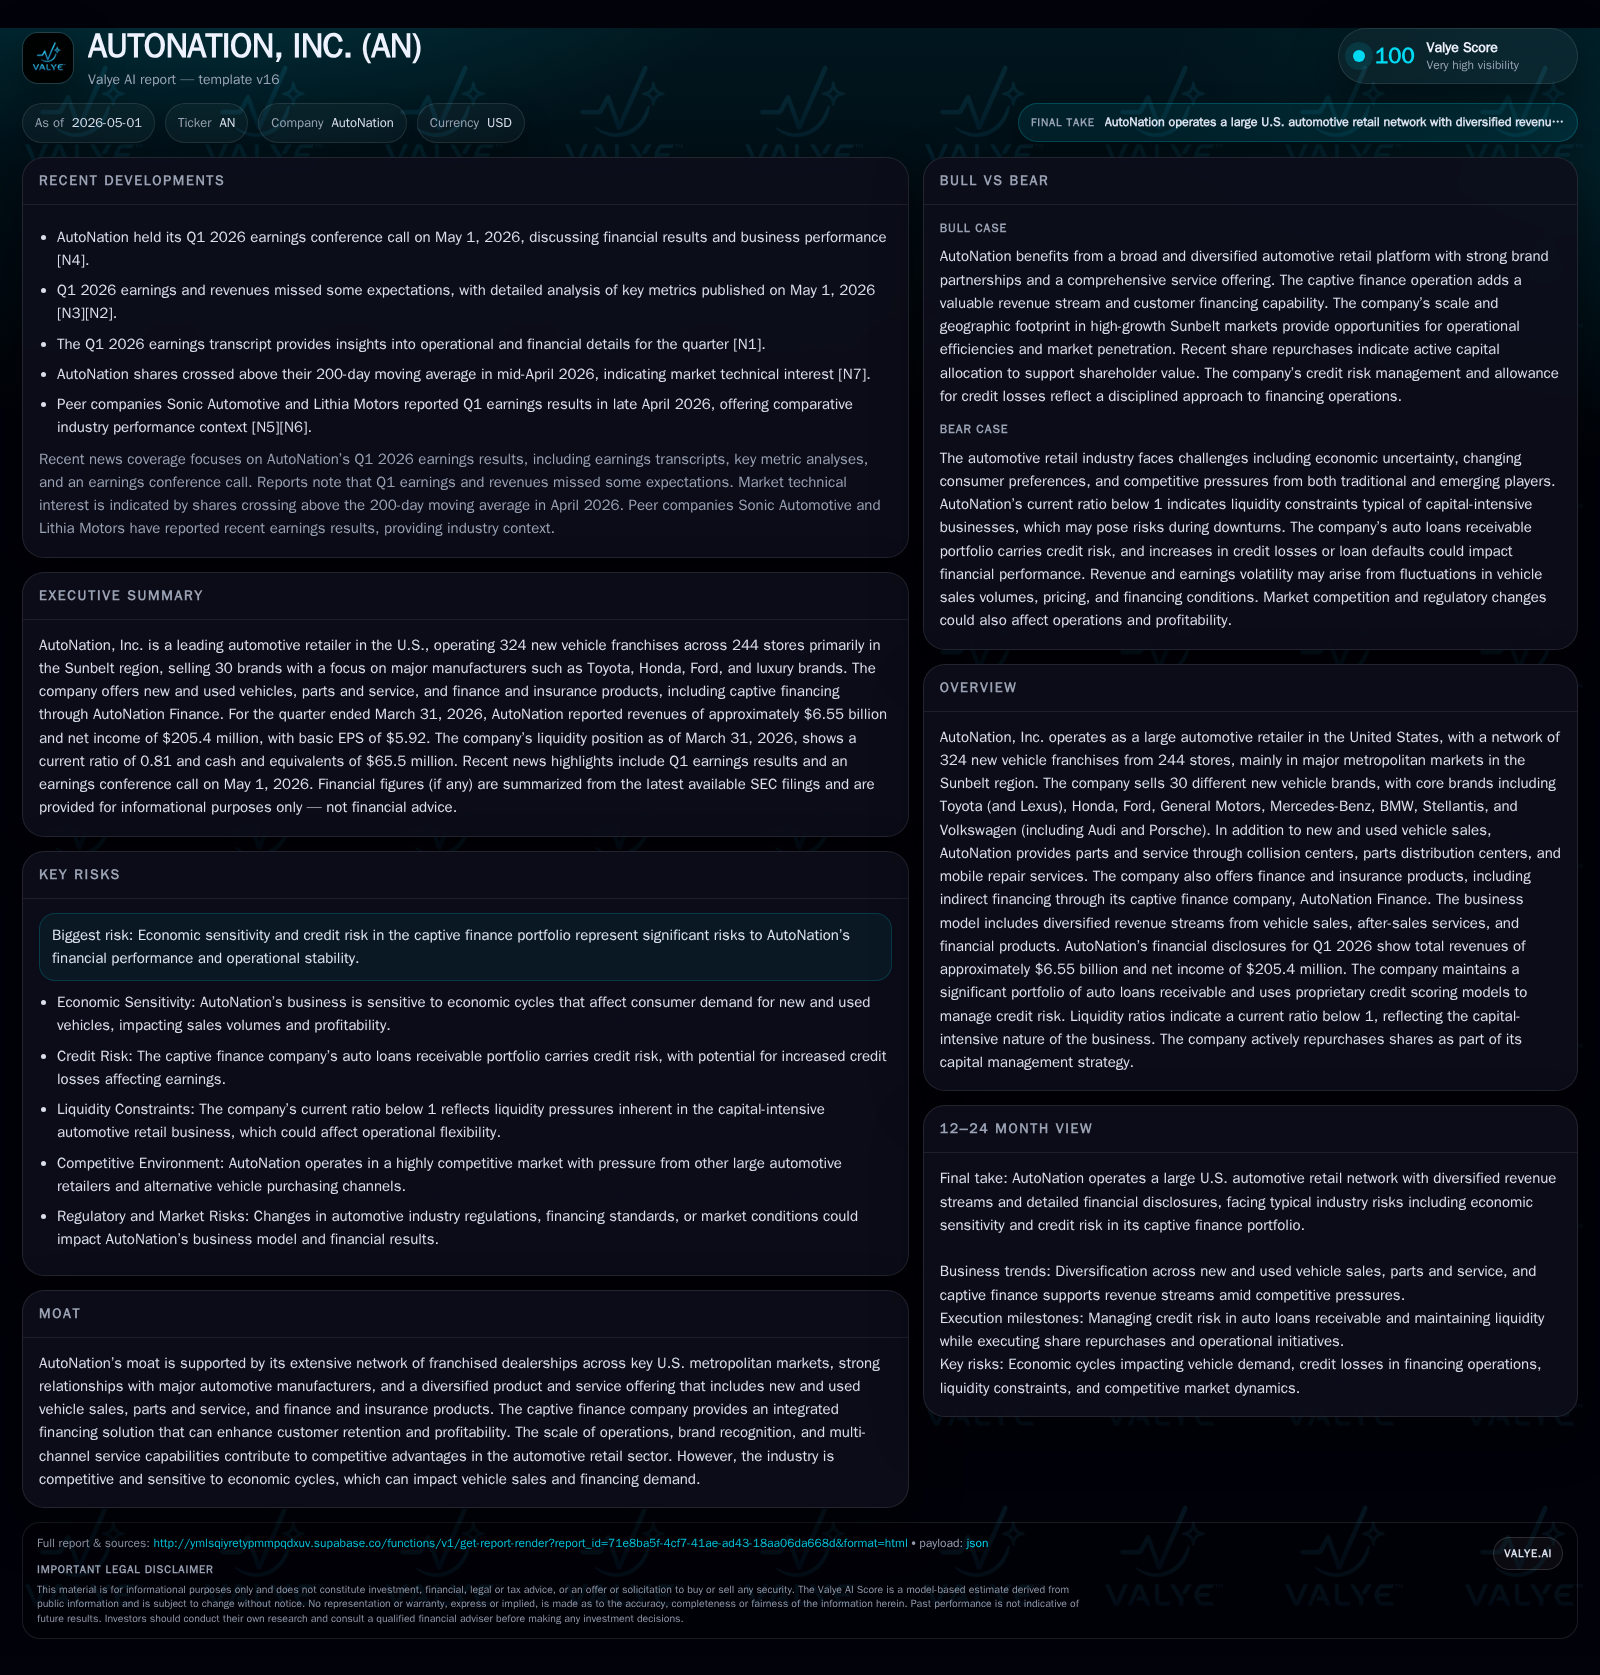
In its latest quarterly filing, AutoNation reported a slight decline in new vehicle revenue but maintained steady finance and insurance income, underscoring the resilience of its captive finance business. The company continues to leverage a broad portfolio of brands and services across a large franchise network concentrated in Sunbelt metros, balancing cyclical auto retail demand with structural growth in after-sales and financing segments. Risks mainly stem from economic sensitivity affecting vehicle sales volume and credit risk exposure within its loan receivables portfolio. Key upcoming indicators include used vehicle pricing trends, auto loan credit loss rates, and operating leverage given current inventory dynamics.
Recent Operating Update
AutoNation's Q1 2026 earnings reveal a nuanced picture where the company experienced softness in new vehicle sales but resiliency in other key segments. New vehicle revenues declined to approximately $3.01 billion compared to $3.25 billion in the prior-year quarter, signaling that demand for fresh fleet purchases is under pressure as consumers remain cautious or face elevated financing costs [S2], [S29]. Used vehicles and parts & service businesses expanded modestly, with revenues of about $1.96 billion and $1.22 billion respectively for the quarter. Finance and insurance net income remained stable at around $352 million, evidencing strength in AutoNation's captive financing operations even as overall retail volumes softened [S29].
Non-recourse debt linked to AutoNation Finance’s loan portfolio rose sharply to $2.11 billion by March 31, largely due to term securitization issuances that support long-term funding of auto loans receivable [S8], [S9], [S23]. This reflects a proactive approach to scaling finance assets while managing interest rate resets via diversified debt maturities.
Business Model
AutoNation operates primarily as an automotive retailer with an extensive dealership footprint: 244 stores housing 324 franchises predominantly located in U.S. Sunbelt metropolitan areas—a region noted for population growth and relatively favorable economic conditions. The company offers approximately thirty different vehicle brands across domestic, import, and premium luxury categories including Toyota (and Lexus), Honda, Ford, GM, Mercedes-Benz, BMW, Stellantis group (Jeep/Dodge/Chrysler), Volkswagen (Audi/Porsche) among others [S1].
Its revenue streams are diversified into four main categories:
- New Vehicle Sales: Direct sale of new cars sourced under franchise agreements.
- Used Vehicle Sales: Certified pre-owned and other used inventory transactions.
- Parts & Service: Ongoing maintenance, repair services including collision centers plus parts distribution.
- Finance & Insurance (F&I): Net income generated primarily through AutoNation Finance’s captive lending operation offering indirect financing solutions bundled with insurance products.
The embedded captive finance business differentiates AutoNation by enabling tighter integration of vehicle sales with tailored financing packages—bolstering customer retention through streamlined credit underwriting and providing incremental margin through interest spreads minus credit losses. The financing platform uses asset-backed warehouse lines and term securitizations to fund loans receivable securely isolated via bankruptcy-remote special purpose vehicles [S8], [S9].
Furthermore, the company exercises disciplined inventory management—reflected by controlled floorplan debt usage—to mitigate excess carrying cost risk amid fluctuating vehicle supply-demand dynamics.
Industry Structure and Competitive Position
Auto retailing is intensely competitive yet structurally fragmented given regional market nuances requiring scale economies combined with localized customer engagement capabilities. AutoNation’s strength lies in its sizeable dealership network concentrated along high-growth coastal and Sunbelt metros which experience more robust demographic tailwinds compared with Rust Belt or rural locales.
The company leverages long-standing relationships with OEMs resulting in preferential allocation of franchise rights across mass-market brands complemented by access to premium luxury segments providing margin cushioning during variable market cycles. Additionally, the multi-channel sales approach—including physical dealerships integrated with digital commerce capabilities—positions AutoNation effectively against rising direct-to-consumer competition from manufacturer-led online sales models.
The F&I captive finance operation serves as a moat component by creating switching costs through integrated financing offerings that combine competitive auto loans with ancillary products such as extended warranties and insurance plans customized at point of sale.
Competition arises not only from national peers like Lithia Motors or Sonic Automotive but also from expanding online platforms (e.g., Carvana) introducing technology-enabled transaction efficiency competing predominantly on price transparency and convenience rather than full-service dealer experience.
Growth Drivers
Structural drivers include accelerating used vehicle market penetration fueled by affordability constraints limiting new car purchase frequency alongside steady replacement demand supporting parts & service revenue stability. The growing importance of electric vehicles could generate aftermarket opportunities though currently represents a smaller portion of total sales volume requiring strategic adaptation over time.
Expansion of captive finance assets is another pivotal growth vector; AutoNation Finance increased its auto loans receivable portfolio with risk-tiered credit programs (Palladium tier weighted average FICO ~733) showing improved credit quality lowering expected loss provisions despite raising overall lending volume [S2], [S27]. This not only drives higher F&I contribution but also typical cross-sell paths into ancillary financial services enhancing lifetime customer value.
Geographic footprint enhancements or selective dealership acquisitions (though none reported in Q1 ’26) may supplement organic growth through extending brand reach within attractive markets especially where competitors lack presence or scale advantage.
Technology adoption aimed at better integrating inventory management systems alongside omnichannel consumer engagement tools can provide operational leverage helping improve service efficiency and ultimately margins over time.
Risks / Watchpoints / Growth Constraints
The key vulnerabilities revolve around macroeconomic cyclicality impacting new vehicle purchase decisions—higher interest rates or economic downturns can reduce discretionary consumer spending causing unit volume contractions disproportionally affecting front-end margins due to fixed store operating costs [S1], [N3].
Credit risk associated with the captive loan portfolio remains significant; though credit quality improved reflected by decreased expected loss rates on newer originations this segment is exposed to economic shocks potentially increasing delinquencies or losses especially if broader employment or wage growth falters [S2], [S27].
Inventory availability constraints or supply chain disruptions can impede ability to meet consumer demand efficiently placing downward pressure on retail prices.
Competitive pressures from OEM direct-to-consumer initiatives threaten traditional franchised dealer economics by bypassing intermediaries altering future commission frameworks.
Regulatory changes including environmental mandates shaping electric vehicle adoption patterns may require upfront investments altering product mix profitability temporarily.
What To Watch Next
Investors should monitor subsequent quarters’ metrics on:
- Used vehicle pricing trends acting as bellwether for margin sustainability outside new sales;
- Credit loss provisions within AutoNation Finance signaling shifts in borrower risk appetite or economic stress;
- Inventory turn rates indicating supply-demand balance adjustments;
- Operating income margin trends reflecting cost control effectiveness given top-line revenue mix shifts;
- Any announced dealership acquisitions or disposals that would materially alter footprint coverage.
- Guidance updates reflecting macroeconomic outlook adaptations particularly relevant for short-cycle new car volumes.
Financial Profile Summary (Q1 2026)
Latest financial snapshot
| Metric | Value | Period |
|---|---|---|
| Cash & equivalents | $66mm | |
| 2026-03-31 | ||
| Total debt | $3.7bn | |
| 2025-12-31 | ||
| Net debt | $3.6bn | |
| 2025-12-31 | ||
| Current assets | $4.6bn | |
| 2026-03-31 | ||
| Current liabilities | $5.6bn | |
| 2026-03-31 | ||
| Current ratio | 0.81x | |
| 2026-03-31 |
Source: SEC companyfacts cache [F1].
| Metric | Value | Period Ending |
|---|---|---|
| Cash & Equivalents | $65.5 million | |
| 2026-03-31 | ||
| Current Assets | $4.58 billion | |
| 2026-03-31 | ||
| Current Liabilities | $5.63 billion | |
| 2026-03-31 | ||
| Total Debt | $3.70 billion | |
| 2025-12-31 | ||
| Net Debt (Debt - Cash) | ~$3.64 billion | Approx Q1’26 |
| Current Ratio | 0.81 | |
| 2026-03-31 |
The company shows a below-par current ratio indicative of inventory-heavy working capital structure typical for auto dealerships reliant on timely resale turnover. Long-term leverage is moderate considering consistent access to commercial paper markets complemented by revolving credit lines providing financial flexibility [F1]. Active share repurchase programs continue deploying capital back to shareholders amid cash flow generation supported by operating profits albeit with some compression relative to peak performance periods due to sales volatilities [S22], [S26].
This analysis synthesizes recent SEC filings alongside validated numeric data sources without offering investment recommendations or price forecasts per policy guidelines. It aims solely to provide an insightful operating context grounded on verified disclosures.
Disclaimer: This is research-only, informational analysis and not investment advice. It may include AI-generated interpretation and general industry context. Always verify important details using primary sources.
Comments