
Ashland Inc. Faces Margin Pressure as Competitive and Raw Material Challenges Intensify
Q2 2026 results highlight operational headwinds amid Ashland's strategic focus on innovation and sustainability.
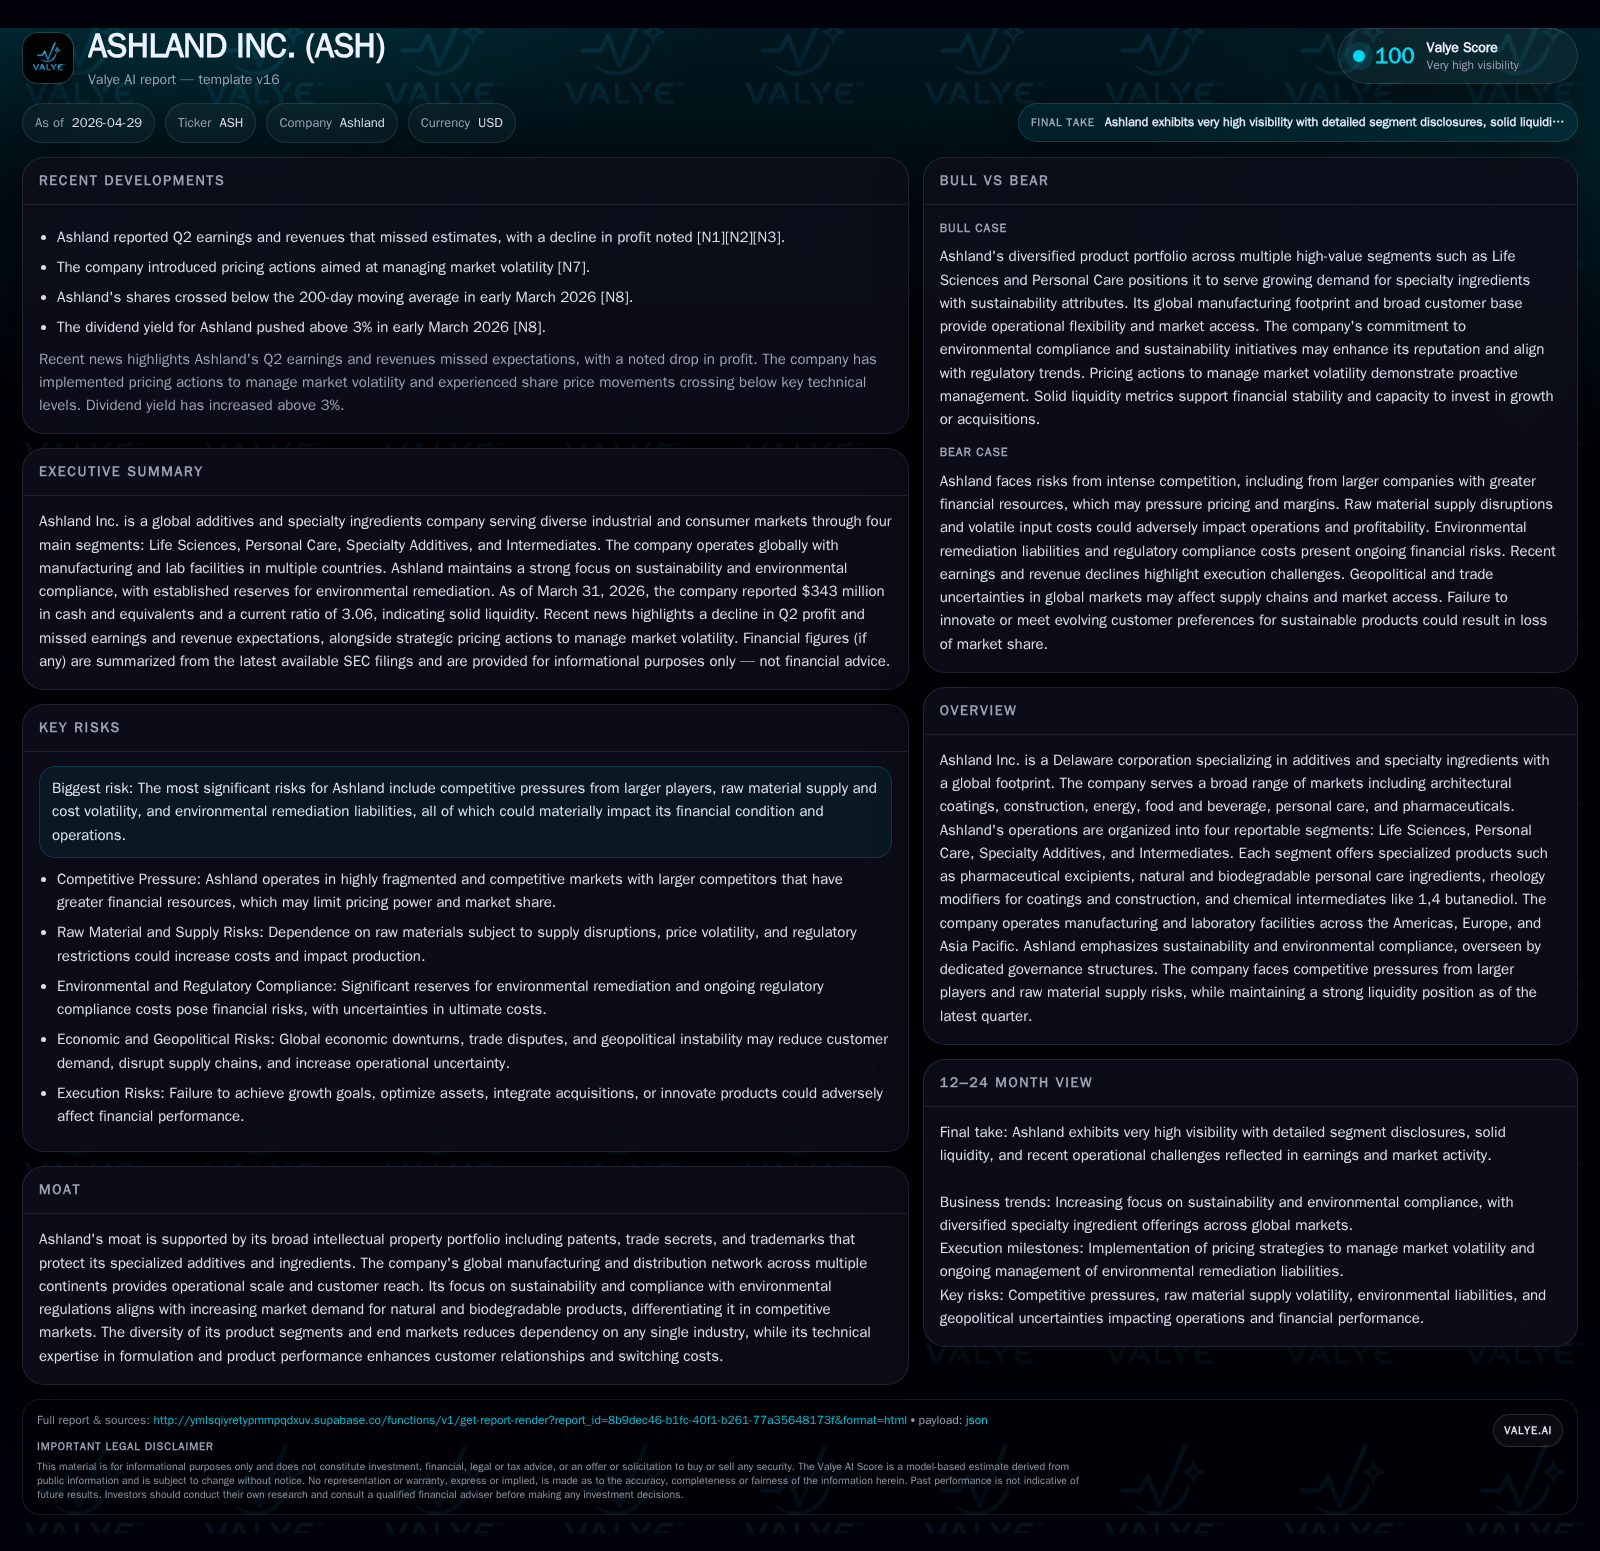
Ashland Inc.'s latest quarterly filing reflects ongoing challenges in margin compression and revenue growth pressures stemming from a competitive additives and specialty ingredients landscape. The company continues pursuing growth via its diversified segments—Life Sciences, Personal Care, Specialty Additives, and Intermediates—leveraging its global manufacturing footprint and IP portfolio. However, raw material cost volatility, regulatory compliance expenditures, and intense competition underscore constraints to near-term expansion. Ashland remains committed to product innovation targeting sustainability trends while navigating industry cyclicality and geopolitical risks.
Latest Operating Update
Ashland Inc.’s Q2 2026 results reported on April 29 reveal ongoing margin pressures despite efforts to manage volatility through pricing actions implemented earlier in the year [S2][N3][N10]. The company disclosed weaker-than-expected revenue growth with operating income impacted by elevated raw material costs and competitive price concessions. There were no material changes to risk factors compared to the prior annual report [S19], signaling persistent challenges related to market conditions rather than emergent issues.
Management emphasized continued execution of initiatives focused on product innovation—particularly around natural and biodegradable chemistries—and sustainability-driven investments. These efforts underpin Ashland’s strategic positioning across multiple end markets but have yet to fully offset near-term cost headwinds.
Business Model
Ashland operates as a global additives and specialty ingredients manufacturer addressing multiple industrial and consumer sectors through four primary segments: Life Sciences, Personal Care, Specialty Additives, and Intermediates [S8]. The business model centers around developing high-performance chemical formulations tailored for applications ranging from pharmaceuticals (e.g., controlled release polymers, excipients) to personal care (natural/moisturizing ingredients), architectural coatings (rheology modifiers), construction materials, energy solutions, food & beverage additives, and chemical intermediates like 1,4-butanediol (BDO).
Revenue generation arises primarily from B2B sales where customers pay for specialized product formulations that meet stringent quality standards with embedded intellectual property protections such as patents and trade secrets [S10]. Volume growth is driven by adoption of new product platforms while pricing power is linked to product differentiation combined with cost pass-through capabilities given raw material volatility. Ashland leverages long-term supply contracts for key raw materials but faces risks relating to supplier availability and price fluctuations [S14][S24].
The company’s diverse geographic footprint—with manufacturing facilities strategically located in North America, Europe, and Asia Pacific—supports global customer reach but also introduces complexity due to differing regulatory environments and geopolitical risk exposures [S9][S16]. This scale enables operational agility but requires robust supply chain management.
Industry Structure and Competitive Position
Operating within the fragmented global specialty chemicals sector for additives, Ashland competes against multinational industrial chemical companies often larger in scale with greater financial resources [S10][S26]. Competitive differentiation hinges heavily on technology leadership via advanced formulation R&D capabilities supporting specialized functionalities—for example naturality in personal care or enhanced rheology in coatings.
The industry exhibits moderate cyclicality linked to end-market demand cycles such as construction or pharmaceuticals development timelines. Price competition is intense given the commoditized nature of some input chemicals juxtaposed with premium segments requiring innovation-driven pricing resilience. Competitors’ broader portfolios sometimes challenge Ashland’s market share especially in declining segments.
Ashland’s moat derives substantially from its broad IP portfolio coupled with technical expertise that supports high switching costs for customers once integrated into formulations; combined with its expanding offerings aligned with sustainability trends that command increasing market preference globally [S10][S17][S28].
Growth Drivers
Key drivers include:
- Innovation in Sustainable Chemistries: Increasing demand for biodegradable, nature-derived additives especially in Personal Care is fueling product development focused on biofunctionals, microbial protectants, and eco-friendly polymers [S1][S28].
- Expanding End Markets: Geographic expansion into emerging economies where industrialization boosts Construction/Coatings demand supports Specialty Additives segment growth.
- Strategic Acquisitions: Ashland pursues targeted bolt-ons to complement technology platforms; however integration execution remains critical to realize synergies without goodwill impairment risks experienced previously [S22].
- Regulatory Alignment: Meeting evolving chemical safety regulations provides both cost challenges but also competitive opportunity by offering compliant formulations ahead of peers.
- Customer Collaboration: Close R&D partnerships enable co-developed tailored solutions enhancing customer retention amid rising formulation complexity.
Risks / Watchpoints / Growth Constraints
- Raw Material Volatility: Fluctuations in hydrocarbon derivatives, agricultural inputs (e.g., guar), and energy costs pressure margins; limited ability to fully pass costs onto customers during weak demand phases constrains profitability [S14][S28].
- Environmental Liabilities: Significant reserves (~$226M) allocated for remediation obligations expose cash flow under adverse scenarios; regulatory tightening could impose further costs [S20][S25].
- Competitive Intensity: Larger competitors may leverage scale advantage impacting pricing; failure to innovate risks market share loss.
- Geopolitical & Supply Chain Risks: Global footprint subjects operations to tariff shifts, trade tensions (notably US-China-EU dynamics), labor law complexities, plus potential catastrophic events disrupting production or logistics [S9][S22].
- High Leverage Profile: Net debt exceeds $1 billion as of March 31 2026 limiting financial flexibility for opportunistic investments or buffering downturns [F1].
- Regulatory Compliance Costs: Increasing regulatory scrutiny necessitates ongoing investment to maintain certifications and meet chemical substance restrictions globally.
- Talent Retention: Success depends on senior management continuity—any leadership turnover could delay strategy execution [S23][S26].
What to Watch Next
Investors should monitor Ashland's ability to:
- Sustain margin recovery amid raw material price normalization or improved pricing power.
- Successfully execute recently announced pricing actions targeting market volatility mitigation [N10].
- Gain traction for new sustainable product innovations validated through order backlog or customer feedback metrics.
- Manage environmental remediation expenses within established reserve levels without incremental cash outflows.
- Navigate geopolitical uncertainties impacting supply chains particularly between US/EU/Asia regions.
- Deliver effective integration outcomes from any acquisitions announced post-Q2 2026.
- Provide updated guidance reflecting near-term macroeconomic or regulatory developments during upcoming earnings releases.
Financial Snapshot (As of Q1 2026)
Latest financial snapshot
| Metric | Value | Period |
|---|---|---|
| Cash & equivalents | $343mm | |
| 2026-03-31 | ||
| Total debt | $1383mm | |
| 2026-03-31 | ||
| Net debt | $1040mm | |
| 2026-03-31 | ||
| Current assets | $1209mm | |
| 2026-03-31 | ||
| Current liabilities | $395mm | |
| 2026-03-31 | ||
| Current ratio | 3.06x | |
| 2026-03-31 |
Source: SEC companyfacts cache [F1].
| Metric | Value | Period Ending |
|---|---|---|
| Cash & Equivalents | $343 million | |
| 2026-03-31 | ||
| Total Debt | $1.383 billion | |
| 2026-03-31 | ||
| Net Debt | ~$1.04 billion | |
| 2026-03-31 | ||
| Current Assets | $1.209 billion | |
| 2026-03-31 | ||
| Current Liabilities | $395 million | |
| 2026-03-31 | ||
| Current Ratio | 3.06 | |
| 2026-03-31 |
This elevated leverage ratio necessitates diligent capital management yet the strong current ratio indicates adequate short-term liquidity coverage supporting working capital needs [F1].
Disclaimer: This analysis is intended solely for informational purposes based on publicly available filings as of April 29, 2026. It does not constitute investment advice or recommendations regarding Ashland Inc. or its securities.
Disclaimer: This is research-only, informational analysis and not investment advice. It may include AI-generated interpretation and general industry context. Always verify important details using primary sources.
Comments