
Bank of America in 2026: Navigating Revenue Divergence, Market Risks, and the Stakes of Scale Ambition
Bank of America enters late 2026 with robust quarterly results, a massive liquidity base, and a renewed focus on branch expansion and AI-driven operational efficiency. Yet, as revenue trends diverge from peers and macroeconomic uncertainties loom, the real test lies in how effectively the bank’s diversified model can absorb shocks, manage cost of funding, and extract durable value from its scale.
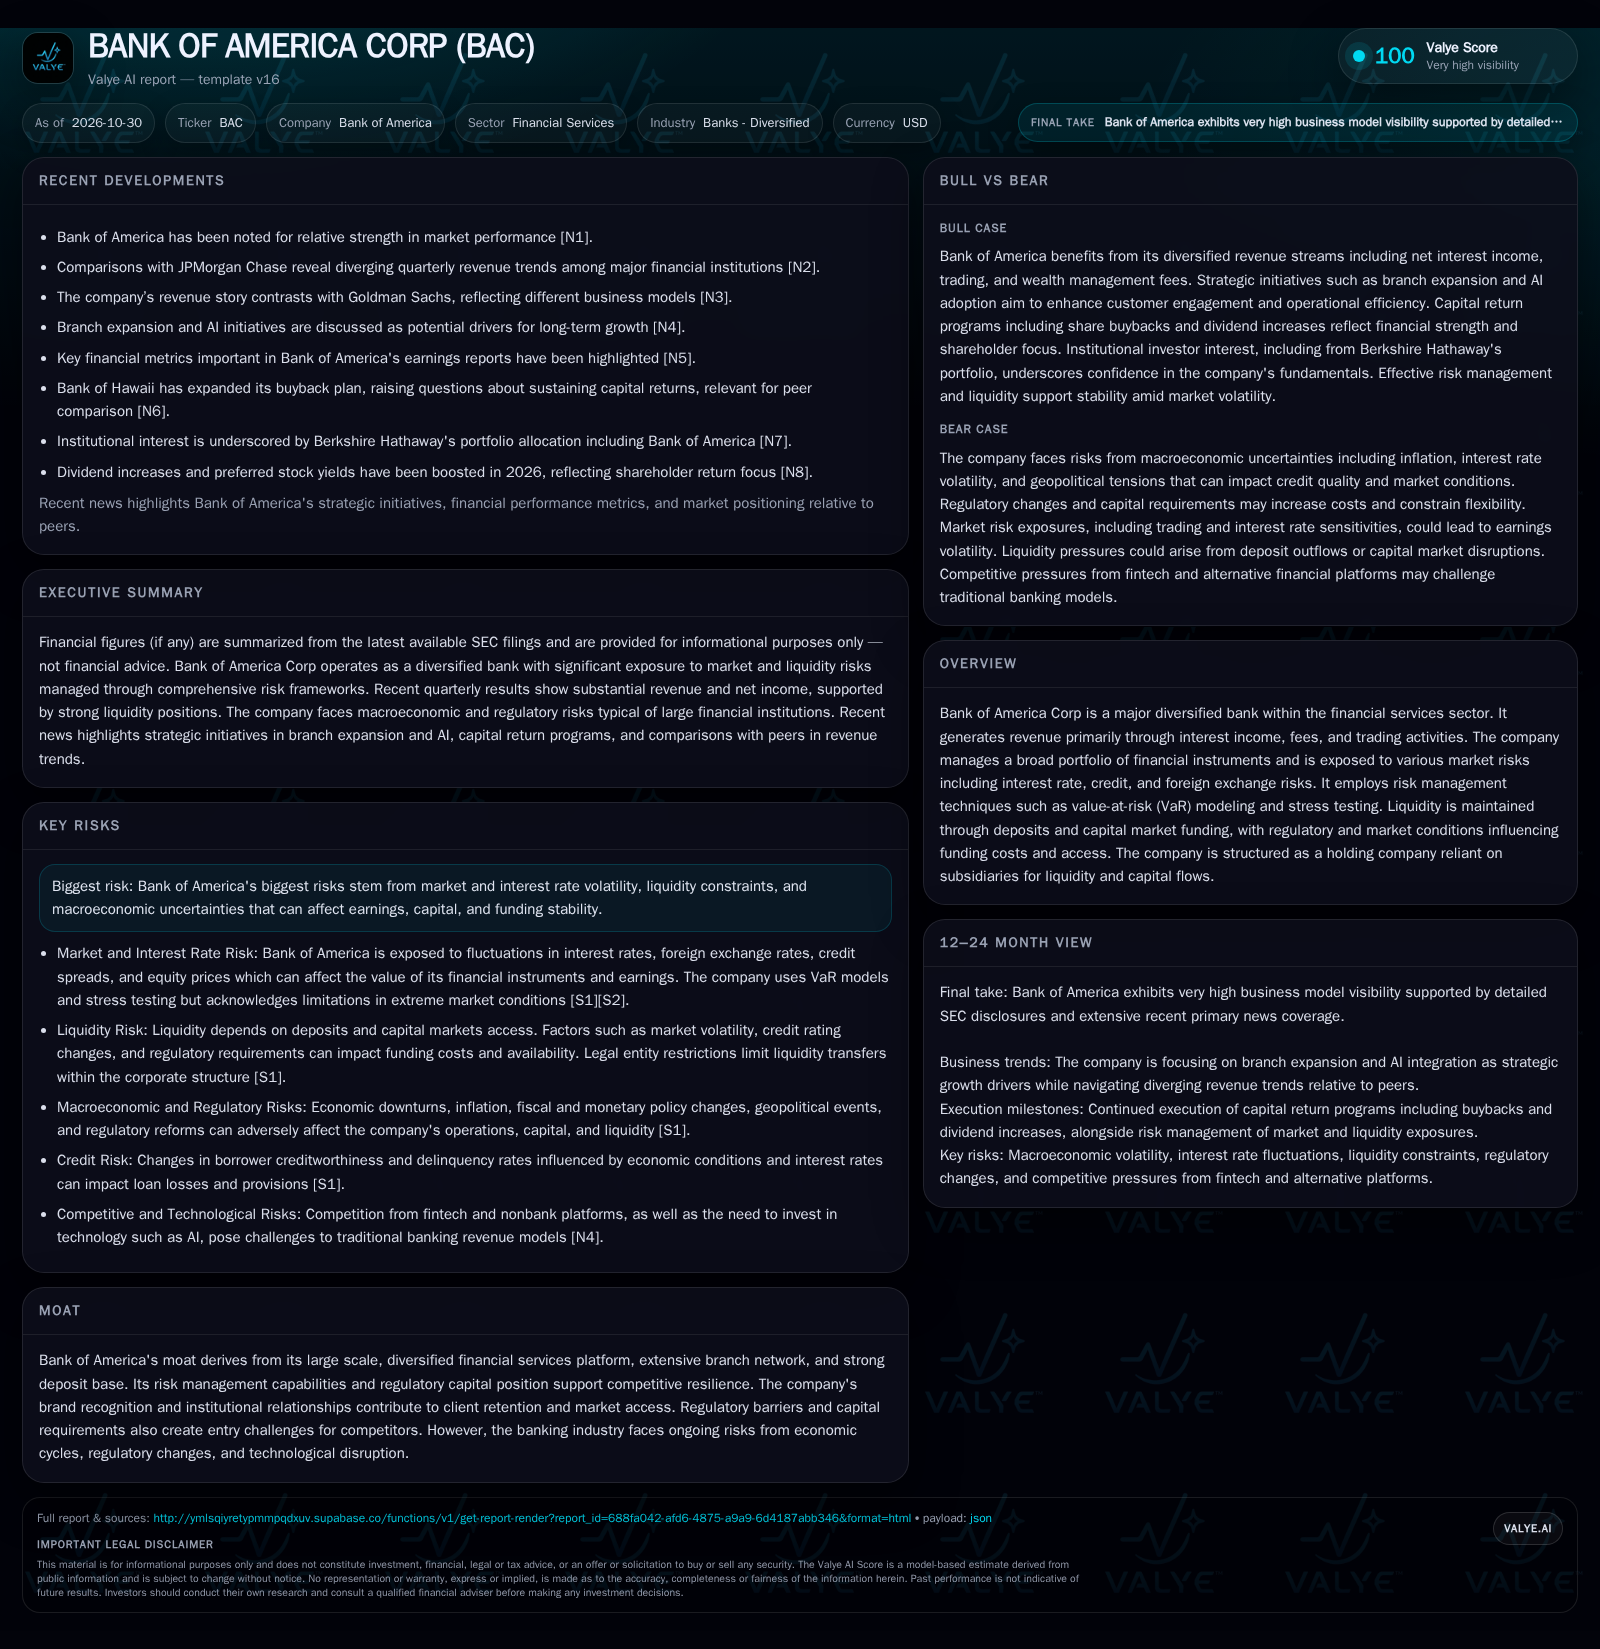
Bank of America reported nearly $30 billion in quarterly revenue and substantial net income for Q3 2026, underpinned by a $301 billion cash position. The bank’s strategic emphasis on branch expansion and AI adoption aims to drive future growth, but the operating environment is defined by heightened market, interest rate, and regulatory risks. Diverging performance versus major competitors highlights both the resilience and the constraints of its diversified model.
Bank of America’s third quarter 2026 results underscore the scale and complexity of a global banking franchise at a crossroads. However, diverging revenue trends compared to other large financial institutions, ongoing macroeconomic volatility, and the push into branch network expansion and AI-driven efficiencies raise new questions about the durability and adaptability of its business model. The real challenge for Bank of America is not just navigating risk, but translating its scale and diversification into sustained, high-quality growth.
2026 Financial Foundation and Strategic Initiatives Define the Moment
Bank of America reported $29.958 billion in revenue and $6.933 billion in net income for the third quarter of 2026, with basic EPS of $0.93 and diluted EPS of $0.91 [S2]. The bank’s cash and cash equivalents stood at $301.006 billion as of September 30, 2026 [S2]. These figures highlight continued operational scale and reported liquidity position in a period marked by macroeconomic uncertainty. Management’s focus on branch expansion and AI-driven initiatives signals an intent to modernize and deepen customer engagement, but the pace and magnitude of their impact remain to be established [N4]. Diverging revenue trends versus key competitors such as JPMorgan Chase and Goldman Sachs underscore the importance of understanding Bank of America’s unique business mix and risk profile [N2] [N3].
Revenue Streams, Margin Drivers, and the Mechanics of Scale
Bank of America’s economic engine is built on three main pillars: net interest income (NII), non-interest income (fees, trading, wealth management), and scale-driven cost efficiency. NII is shaped by the spread between asset yields and funding costs, which is particularly sensitive to interest rate movements. As an asset-sensitive institution, Bank of America stands to benefit when short- and long-term rates rise in parallel, but is exposed to margin compression if funding costs increase faster than asset yields or if the yield curve inverts [S2]. Non-interest income provides diversification—trading, investment banking, and wealth management fees can offset or amplify core lending cycles, depending on market volatility and client activity.
The bank’s cost structure is a mix of substantial fixed costs (branch network, technology infrastructure, regulatory compliance) and variable expenses tied to activity levels. Operational leverage is realized when revenue grows faster than expenses, but regulatory requirements and technology investments limit the ability to aggressively cut fixed costs. Funding comes primarily from a vast deposit base, which is relatively low-cost but increasingly sensitive to rate competition and digital alternatives. Capital and liquidity requirements impose minimum thresholds but also act as a competitive moat for institutions able to absorb these burdens at scale.
Capital intensity remains high: regulatory capital ratios, stress test requirements, and the need to continually invest in technology (including AI and cybersecurity) shape both strategic flexibility and return on equity. In this environment, the ability to manage credit risk, optimize funding mix, and extract efficiency from scale will determine the sustainability of margins and competitive positioning.
Scale and Diversification Versus Fintech Disruption and Peer Divergence
Bank of America’s core competitive advantages—national scale, diversified product suite, massive deposit base, and regulatory credentials—have historically provided resilience against shocks and enabled cross-selling across consumer, commercial, and wealth management segments. Brand recognition and entrenched relationships with both retail and institutional clients support retention and market access, while regulatory barriers limit credible new entrants at meaningful scale.
However, the competitive landscape is shifting. Fintechs and digital-first banks are eroding the stickiness of traditional deposit bases and raising the bar for customer experience, especially among younger demographics. Meanwhile, peer institutions such as JPMorgan Chase have outperformed Bank of America in certain revenue growth metrics, reflecting differences in business mix, risk appetite, and geographic exposure [N2]. The divergence with investment-banking-heavy peers like Goldman Sachs further illustrates the impact of business model specialization [N3].
The arms race in technology—AI for underwriting, risk management, and customer engagement—raises both opportunity and execution risk. While Bank of America’s size allows for large-scale investments in digital transformation, the challenge is translating these into tangible improvements in customer retention, operating efficiency, and new revenue streams before fintech competitors can scale up to threaten core profit pools.
Branch Expansion and AI Deliver Sustainable Margin Gains
In the most favorable scenario, Bank of America’s investments in branch expansion and AI-driven process automation translate into higher customer acquisition, improved retention, and lower per-unit servicing costs. If the yield curve remains favorable and deposit beta (the rate at which deposit costs rise with market rates) stays contained, net interest income could expand meaningfully. Enhanced digital engagement may enable fee income growth through wealth management and payments, offsetting cyclicality in trading and investment banking.
Evidence supporting this scenario would include sustained positive operating leverage (revenue growth outpacing expense growth), improving efficiency ratios, and rising fee income as a percentage of total revenue. Faster-than-peer deposit growth in new or expanded markets, coupled with stable credit quality and low attrition rates, would confirm that the strategy is gaining traction. If disclosed, improvements in customer satisfaction or digital engagement metrics would further validate the upside thesis.
Diversified Model Buffers Against Macro Shocks but Limits Outperformance
The most plausible trajectory is that Bank of America’s diversified business mix provides earnings stability but moderates the potential for outsized growth or margin expansion. Net interest income may remain resilient if interest rates stabilize, but competition for deposits and digital channels could erode cost advantages over time. Fee income and trading revenues likely continue to fluctuate with market cycles, providing ballast but not a consistent growth engine.
Expense growth is likely to track inflation and regulatory compliance needs, offsetting some of the benefits of technology-driven efficiencies. Credit costs may rise modestly if economic conditions soften, but the bank’s risk management frameworks and diversified loan book should prevent outsized losses. This scenario would be confirmed by stable or mildly improving efficiency ratios, a steady return on equity near historical averages, and earnings volatility that tracks macroeconomic indicators rather than idiosyncratic shocks.
Interest Rate Volatility and Deposit Flight Expose Margin Vulnerabilities
A less favorable outcome could unfold if interest rate volatility persists or intensifies, causing funding costs to rise faster than asset yields and compressing net interest margins. In this scenario, deposit competition from both traditional and digital banks accelerates outflows or forces Bank of America to raise rates aggressively, increasing funding costs and weakening profitability. A flattening or inverted yield curve would exacerbate these pressures, particularly for an asset-sensitive balance sheet.
Credit quality could deteriorate if macroeconomic conditions worsen, leading to higher loan loss provisions and pressure on net income. Regulatory or geopolitical shocks could further restrict capital markets access or raise compliance costs. Signs of this scenario would include declining net interest margins, negative operating leverage (expenses rising faster than revenues), rising charge-offs, and deterioration in key regulatory capital ratios. If disclosed, a spike in deposit outflows or a marked increase in short-term funding reliance would further validate the downside risk.
Milestones That Will Shape Bank of America’s Resilience and Growth
Quarterly trends in net interest margin and deposit beta—if disclosed—will be critical for assessing the sustainability of core lending profitability.
Efficiency ratio changes, especially relative to peers, will reveal whether operational leverage from branch and technology investments is being realized.
Rate and composition of deposit growth versus outflows, particularly in digitally competitive geographies, would help test the strength of the deposit franchise.
Credit quality indicators such as non-performing asset ratios and net charge-offs will signal resilience against macroeconomic shocks.
Progress in AI-driven customer engagement and operational automation—if disclosed by management—would confirm whether technology investments translate into durable cost or revenue benefits.
Fee income trends across wealth management, payments, and trading will provide a barometer of diversification effectiveness and competitive positioning.
Capital ratios and regulatory disclosures will indicate the bank’s flexibility to absorb shocks and return capital to shareholders.
Comparative revenue and profit growth versus leading competitors will clarify whether Bank of America’s strategy is driving relative outperformance or lag.
Disclaimer: This is research-only, informational analysis and not investment advice. It may include AI-generated interpretation and general industry context. Always verify important details using primary sources.

Comments