
Brookfield Asset Management Drives Fee-Bearing Capital Growth With Diversified Asset Deployment
Brookfield's Q2 2026 update highlights a robust increase in fee-bearing capital fueled by diverse inflows across asset classes, reinforcing recurring fee revenue growth amidst ongoing valuation and liquidity management complexities.
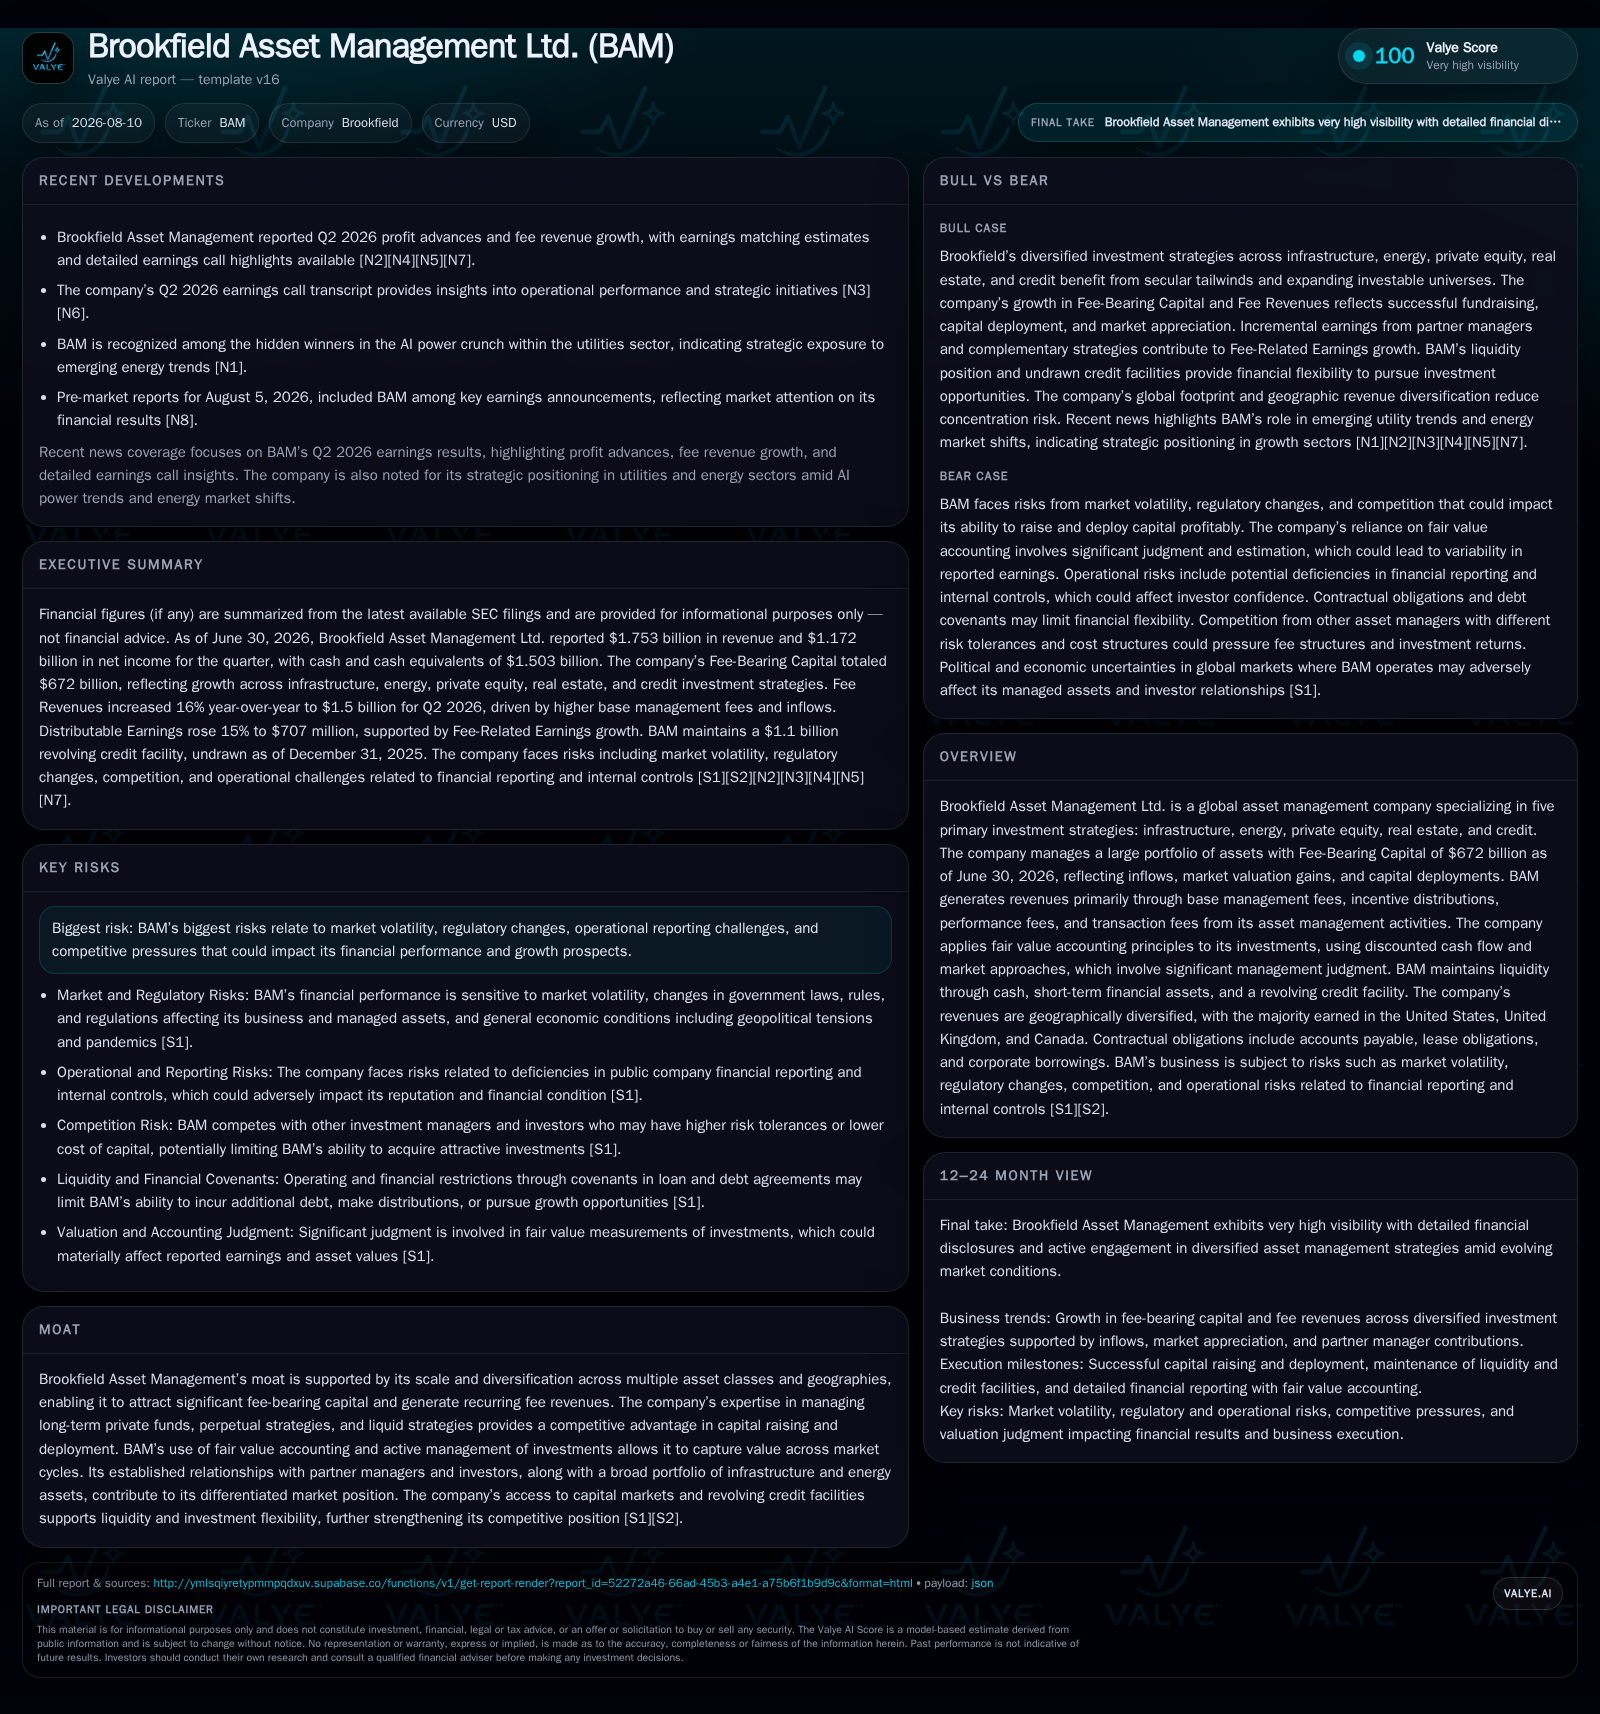
In the quarter ended June 30, 2026, Brookfield Asset Management Ltd. expanded its fee-bearing capital base by $69.4 billion year-to-date to $672 billion, driven by strong inflows across infrastructure, energy, private equity, real estate, and credit strategies. This growth supports a 14% sequential rise in management and advisory fees, reflecting the firm’s ability to generate stable recurring revenues from a diversified capital base. Fair value accounting continues to introduce earnings volatility tied to market valuation changes but remains essential for capturing investment performance. BAM maintains a solid liquidity position with $1.5 billion in cash and access to revolving credit facilities, ensuring flexibility for opportunistic investments. The company’s multi-asset diversification and scale underpin its competitive position among global alternative asset managers. Key risks include valuation uncertainties, regulatory developments, and market volatility affecting fee revenues and distributable earnings.
Fee-Bearing Capital Expansion Fuels Management Fee Momentum
Brookfield Asset Management reported fee-bearing capital (FBC) of $672 billion as of June 30, 2026, up $69.4 billion or 12% since December 31, 2025 [S2]. This growth reflects $87.3 billion of capital inflows into long-term private funds, perpetual affiliates, and liquid strategies against outflows of approximately $26 billion including distributions and redemptions. The quarterly net increase of $58.4 billion (10% from March to June) highlights continued investor confidence in BAM’s diversified alternative investment platform [S2]. Fee-bearing capital represents the committed or invested capital base on which BAM earns recurring management fees; thus this expansion directly supports stronger fee revenue streams [S1].
Diverse Asset Class Inflows Support Broadened Recurring Revenues
Inflows were well distributed across asset classes: infrastructure received $8.3 billion year-to-date driven by perpetual strategy issuances ($4.5 billion) and private fund deployments ($3.6 billion). Energy inflows totaled nearly $3 billion supported by contributions to BEP and other perpetual vehicles [S2]. Private equity attracted $5.9 billion primarily from flagship fund vintages focused on core buyouts [S2]. Real estate saw over $6 billion in inflows linked to new vintage funds and co-investments [S2]. Credit was the largest contributor with $64 billion inflows notably from insurance sector capital through Brookfield Wholesale Solutions [S2]. This diversified inflow profile mitigates concentration risk while enhancing BAM’s recurring fee base.
Management and advisory fees rose 14% sequentially to $183 million in Q2 2026 compared to the prior year quarter [S2], largely driven by gains in perpetual strategies where fees increased nearly 40% year-over-year due to scale effects. The combination of private fund fees with perpetual vehicle revenues provides structural stability amid market cycles that can unevenly impact individual asset classes [S1][S2].
Fair Value Accounting Drives NAV Volatility Impacting Earnings Quality
BAM applies fair value accounting extensively using discounted cash flow models combined with market comparables [S1]. While this approach aligns net asset values (NAVs) with underlying economic realities, it introduces earnings volatility through non-cash valuation adjustments—particularly visible in periods of market uncertainty [S1][S2]. For example, Q2 featured a positive market valuation adjustment of approximately $5.2 billion contributing to NAV growth but not immediate cash flows.
Because performance fees—a meaningful portion of overall fee revenue—depend on realized investment gains relative to these valuations, the quality and durability of earnings hinge on transparent valuation methodologies and consistent application [S1]. BAM emphasizes significant judgment involved in these estimates which investors should monitor alongside realized distributions or reversals.
Strategic Liquidity Position Supports Investment Flexibility
Maintaining liquidity is critical given timing mismatches between investor capital calls, asset deployment schedules, operating expenses, fee receipts, dividend payments, and distributions back to investors [S2]. As of June 30, 2026, BAM held approximately $1.5 billion in cash equivalents complemented by access to a revolving credit facility expanded recently to at least $1.1 billion [S2][F1].
This liquidity buffer enables BAM to deploy capital opportunistically without relying solely on incoming funds or forced asset sales under stress conditions [S3]. The firm also issues commercial paper or longer-term debt instruments strategically to finance growth initiatives such as acquisitions within infrastructure or energy portfolios [S1][S2]. This prudent approach to liquidity management reduces refinancing risks relative to some peers.
Industry Positioning: Scale and Diversification Versus Global Alternatives Peers
Brookfield ranks among the largest global alternative asset managers alongside Blackstone Group and KKR & Co., distinguished by its broad exposure across infrastructure, energy transition assets, real estate, private equity funds, credit products, and liquid strategies. This scale enables sourcing diversified fee-bearing capital from institutional clients including pension funds, sovereign wealth funds, insurance companies (notably via BWS), endowments, and high-net-worth individuals.
Diversification across product lines dampens reliance on any single economic sector or geography while fostering cross-selling opportunities for clients seeking multi-asset exposure within one platform. Peers often specialize more heavily in buyouts or opportunistic credit; BAM’s multi-strategy footprint supports smoother revenue streams over different cycles.
Growth Drivers: Fundraising Strength & Market Appreciation
Global institutional demand for alternatives remains robust given low yields in traditional fixed income combined with inflation hedging needs supporting BAM’s fundraising success this quarter [N1][S2]. Market appreciation also enhances net asset values bolstering potential performance fee accretion beyond base management fees.
BAM’s expansion of perpetual capital vehicles — long-duration funds allowing reinvestment rather than forced exits — improves revenue visibility versus closed-end funds reliant on exits alone [S1][S2]. Strategic acquisitions or partnerships further support incremental AUM growth.
Risks & Watchpoints: Valuation Complexity & Regulatory Environment
Risks persist around fair value accounting complexities that can amplify earnings volatility if assumptions diverge materially from realized outcomes [S1][S2]. Regulatory changes increasing disclosure requirements around valuations may raise compliance costs or delay reporting.
Market volatility impacts both direct investment valuations reducing distributable earnings temporarily and fundraising environments especially within credit markets sensitive to interest rate shifts or underwriting standards [S1]. Operational risks related to integrating new fund launches or technology systems could affect investor relations or financial reporting accuracy.
What To Monitor Next: Fundraising Milestones & Performance Fee Recognition
Key upcoming indicators include the closing progress of flagship long-term private fund vintages noted this quarter ([N3]) alongside updates on perpetual strategy fundraising expected to sustain management fee growth. Performance fees tied to realized gains will be critical signals reflecting operational execution quality beyond mark-to-market effects. Monitoring capital deployment rates relative to commitments will inform risk-adjusted return profiles increasingly scrutinized by institutional clients allocating among global alternatives managers.
Financial Profile Discussion
As of June 30, 2026, BAM reported total debt near $4.08 billion against cash balances approximating $1.5 billion yielding net debt around $2.58 billion consistent with conservative leverage practices for an alternative manager of its scale [F1][S2]. The use of revolving credit facilities supplemented by periodic debt issuances supports liquidity while avoiding excessive short-term funding dependence. Distributable earnings underpin quarterly dividends where BAM targets payout ratios near 90%, balancing shareholder returns with reinvestment needs for growth momentum [S1]. Recent periods demonstrate solid coverage despite variable performance fees reflecting disciplined cost control over compensation expenses linked to fee-related earnings segments [S1][S2]. Overall financial health supports BAM’s capacity for incremental fund launches while sustaining attractive shareholder returns amid a dynamic operating environment typical for large-scale alternative asset managers.
This analysis synthesizes Brookfield Asset Management Ltd.'s latest disclosures through mid-2026 without extrapolating beyond verified SEC filings or company data points. It emphasizes critical metrics central to understanding BAM’s competitive positioning within the global alternative asset management sector characterized by significant scale-driven moats alongside complex valuation methodologies requiring ongoing scrutiny.
Disclaimer: This is research-only, informational analysis and not investment advice. It may include AI-generated interpretation and general industry context. Always verify important details using primary sources.

Comments