
Bed Bath & Beyond's Multi-Brand Turnaround: Q4 2025 Performance and Strategic Outlook
Bed Bath & Beyond's integration of multiple retail brands and digital initiatives underlines its evolving e-commerce strategy amidst ongoing financial recovery and liquidity management.
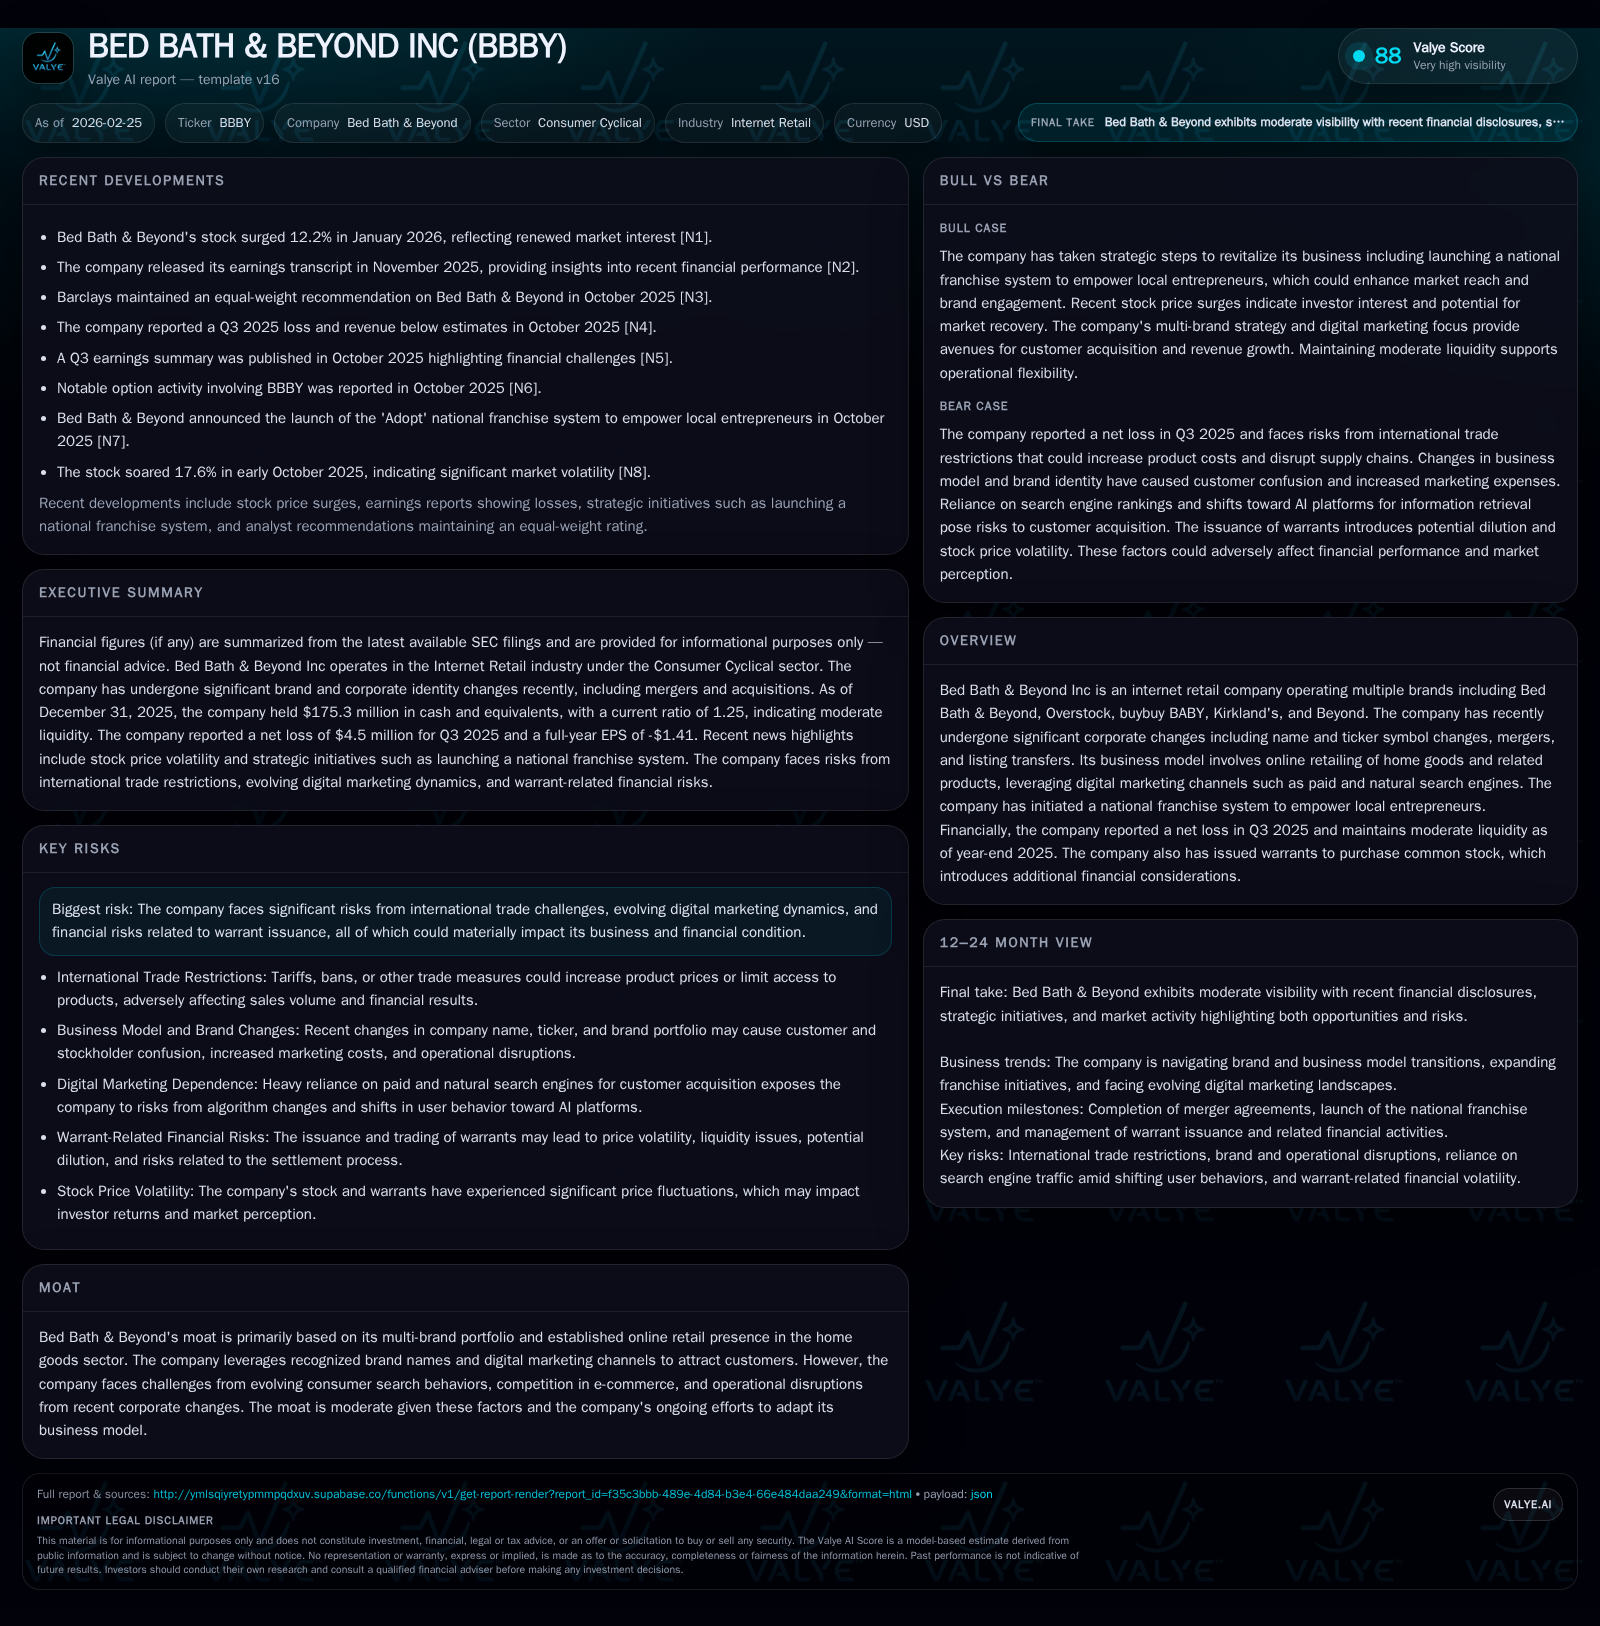
Bed Bath & Beyond Inc has undergone significant corporate restructuring including rebranding and multi-brand integration, positioning itself as a multi-brand internet retail player. Despite meaningful operating income loss reductions in FY2025, the company remains unprofitable with ongoing cash flow deficits and a complex capital structure that includes issued warrants. The national franchise rollout and enhanced digital marketing efforts are key growth drivers, though risks persist from supply chain tariffs and brand repositioning challenges. Investors should closely monitor profitability trends, franchise scaling, cash flow improvements, and liquidity status in upcoming quarters.
Evolution of Bed Bath & Beyond’s Multi-Brand Online Model
Bed Bath & Beyond Inc has transformed from Overstock.com into a multi-brand internet retail platform encompassing legacy names including Bed Bath & Beyond itself, buybuy BABY, Kirkland's, and Overstock. This transition involved multiple corporate actions such as ticker symbol changes (OSTK to BYON to BBBY) and moving its stock listing to the New York Stock Exchange [N2][S1]. The diversified brand portfolio allows expanded customer reach across complementary home goods verticals but adds marketing cohesion challenges.
The company is addressing these through targeted digital marketing strategies leveraging paid search engine traffic acquisition balanced with organic search optimization to adapt to shifting consumer online behaviors [N1][N2]. Concurrently, Bed Bath & Beyond initiated a national franchise system rollout aimed at empowering local entrepreneurs under its established brands—blending e-commerce scale with localized physical presence .
Financial Trajectory and Operating Income Recovery Through 2025
Financial data reveal incremental recovery though continued challenges. Operating income losses improved by roughly 67.9%, narrowing from -$190.97 million in FY2024 to -$61.21 million in FY2025 [F1]. Net income for Q3 2025 was approximately -$4.52 million; however, full annual net income for FY2025 is not available from provided tags [F1].
Operating cash flows remain negative but improved significantly year-over-year: -$56.7 million in FY2025 versus -$174.3 million in FY2024 [F1]. Capital expenditures declined almost by half to $7.4 million in FY2025 compared to $14.3 million prior year reflecting investment discipline.
Equity has contracted from $645.8 million at end-FY2022 to $217.6 million at end-FY2025 resulting in an approximate negative return on equity of -118.9% (latest annual net income divided by equity) [F1]. Free cash flow (operating cash flow minus capex) remains negative at approximately -$64.1 million.
Historical performance (annual)
| FY | Net ($mm) | CFO ($mm) | OpInc ($mm) | Capex ($mm) | Net YoY |
|---|---|---|---|---|---|
| 2025 | -57 | -61 | 7 | ||
| 2024 | -259 | -174 | -191 | 14 | +15.9% |
| 2023 | -308 | -19 | -118 | 19 | -1884.7% |
| 2022 | -16 | -13 | -3 | 15 | -147.1% |
Note: Omitted columns lack sufficient annual XBRL coverage in the provided tags (need ≥2 annual points): Rev, Div, Buybacks, ROE%. Source: SEC companyfacts cache [F1].
Capital returns and efficiency (annual)
| FY | FCF ($mm) |
|---|---|
| 2025 | -64 |
| 2024 | -189 |
| 2023 | -38 |
| 2022 | -27 |
Source: SEC companyfacts cache [F1]. *Latest quarterly net income available only; full year not reported.
Q4 2025 Earnings Highlights
Q4 results showed revenue beating estimates while continuing to narrow net losses compared with prior quarters [N1][N4]. Increased spending on digital marketing—both paid ads and organic search—drove customer acquisition but weighed on short-term profitability.
Early contributions from the franchise system rollout added revenue diversification but incurred scaling expenses limiting immediate profit impact [N2][S3]. Marketing investments increased quarter-to-quarter offsetting top-line gains but aim for long-term retention benefits.
Capital Structure and Liquidity Profile
At year-end 2025 the company held $175.3 million in cash and equivalents with current assets of $240.1 million against current liabilities of $192.1 million yielding a current ratio of 1.25 indicating adequate short-term solvency [F1].
The capital structure includes amended term loan agreements centered around Kirkland’s Stores group as lead borrower with Bed Bath & Beyond acting as administrative agent [S4][S6][S9][S13]. These agreements provide operational flexibility but reflect complexity within the broader brand ecosystem.
Recently issued warrants present potential dilution risk while offering alternative non-dilutive funding sources until exercised [S3][S10]. Investors should consider how warrant exercises may affect future share count and valuation.
Despite improving operating results liquidity burn remains notable given negative free cash flow near $64 million annually requiring ongoing monitoring relative to credit covenant thresholds [F1].
Strategic Growth Initiatives: Franchising and Digital Marketing
Bed Bath & Beyond’s growth strategy centers on expanding its national franchise system empowering local entrepreneurs under well-known brand banners combining brand recognition with regional market agility [N1]. This omnichannel approach aims to capture market share through localized physical presence integrated with e-commerce capabilities.
Digital marketing efforts focus on optimizing paid search engine traffic acquisition balanced by organic search strategies adapting to evolving consumer discovery patterns online [N2]. Managing customer acquisition costs relative to lifetime value remains critical amid competitive pressures.
Together these initiatives target expanding customer base while controlling marketing spend inflation via data-driven campaign targeting designed to improve return on marketing investment over time.
Risks: International Trade and Brand Repositioning Challenges
Significant risks include tariff impacts on China-sourced products comprising large portions of inventory which increase product costs compressing gross margins [S2][S7]. The unpredictability around trade barriers adds operational uncertainty.
Frequent changes in corporate identity—including company name shifts (Overstock.com to Beyond Inc., then Bed Bath & Beyond Inc.), ticker symbol updates (OSTK to BYON then BBBY), and stock exchange listing moves—have introduced brand repositioning complexities potentially leading to customer confusion requiring increased promotional spending or costly customer acquisition efforts [S2][N2].
These dynamics create headwinds for price leverage sustainability amid competitive retail environments.
Metrics for Investor Monitoring
With no detailed forward guidance disclosed [N2], investors should track:
- Operating income trends toward profitability,
- Franchise system expansion pace and contribution margins,
- Efficiency of digital marketing spend measured by customer acquisition cost versus retention,
- Cash burn rate relative to liquidity and credit facility covenants,
- Potential dilution effects from warrant exercises,
- Inventory turnover improvements reflecting supply chain efficiency.
Disclaimer: This analysis is based solely on publicly available SEC filings and news disclosures as of February 2026 without speculative estimates beyond provided data points ([F1],[N1],[N2],[S1],[S3],[S4],[S6],[S7],[S9],[S10],[S13]). No dividend or recent share repurchase information is available in the provided tags.
Disclaimer: This is research-only, informational analysis and not investment advice. It may include AI-generated interpretation and general industry context. Always verify important details using primary sources.
Comments