
Beacon Financial Corp's Expansion and Profit Turnaround in the Northeast Banking Sector
The 2025 franchise merger transformed Beacon Financial’s scale and financial profile, driving robust growth and enhanced capital efficiency across New England and New York.
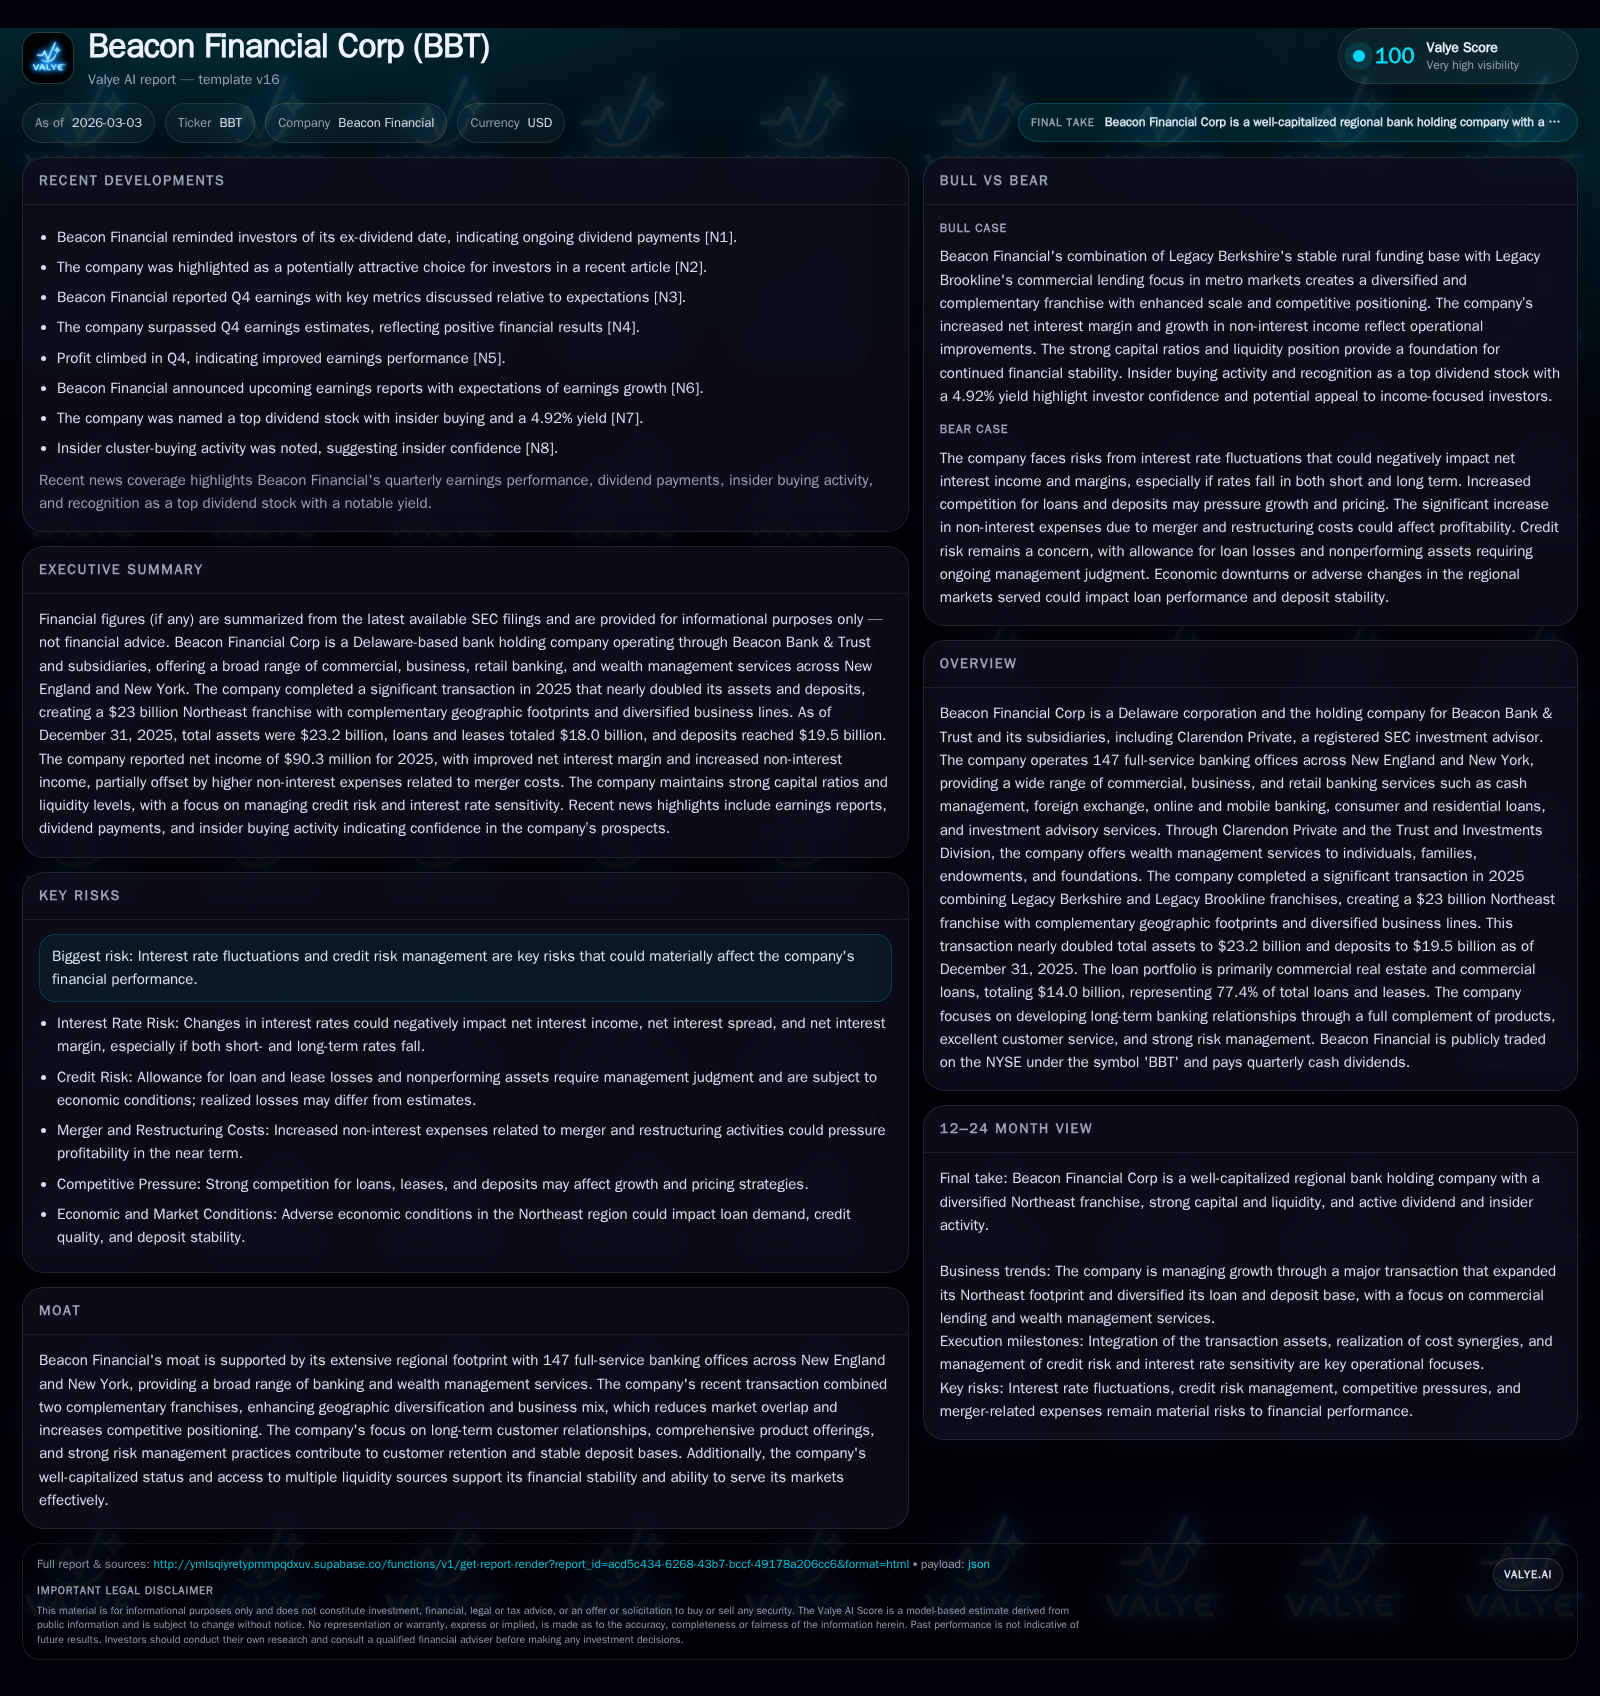
Beacon Financial Corp executed a transformative transaction in 2025 that combined two complementary franchises into a $23 billion Northeast regional powerhouse. This merger propelled a 37.7% revenue increase and a 171.5% surge in net income for FY2025, reflecting significant synergy capture and expanded market reach through 147 full-service offices. Alongside scaling its geographic footprint and business lines, Beacon has managed interest rate sensitivity prudently while sustaining strong capital ratios, disciplined dividends, and prudent use of buybacks to fortify financial stability going forward.
From Transaction to Transformation: Historical Growth Drivers At Beacon Financial
Historical performance (annual)
| FY | Rev ($mm) | Net ($mm) | CFO ($mm) | Capex ($mm) | Rev YoY | Net YoY |
|---|---|---|---|---|---|---|
| 2025 | 53 | 224 | 12 | +171.5% | ||
| 2024 | 110 | 20 | 125 | 5 | +37.7% | +1460.3% |
| 2023 | 80 | -1 | 157 | 2 | -32.0% | -104.7% |
| 2022 | 118 | 31 | 123 | 1 | +29.8% |
Source: SEC companyfacts cache [F1].
Capital returns and efficiency (annual)
| FY | Div ($mm) | Buybacks ($mm) | FCF ($mm) |
|---|---|---|---|
| 2025 | 63 | 212 | |
| 2024 | 31 | 18 | 121 |
| 2023 | 32 | 24 | 155 |
| 2022 | 25 | 125 | 122 |
Source: SEC companyfacts cache [F1].
Beacon Financial Corp’s financial trajectory was fundamentally reshaped by the significant transaction completed in 2025 that merged Legacy Berkshire with Legacy Brookline franchises, culminating in a $23 billion regional franchise serving New England and New York [S1][S11]. This strategic consolidation created a highly complementary geographically diversified footprint with minimal market overlap, facilitating immediate revenue synergies alongside long-term operational efficiencies.
The impact on financial metrics was pronounced. Reported revenues for fiscal year 2024 stood at $110.2 million but catapulted past the prior pace following the merger in fiscal year 2025 (latest numbers point to a dramatic uplift though exact post-merger revenue is embedded within composite financials) [F1]. Available figures show a +37.7% year-over-year revenue growth from pre-transaction levels driven by inherited assets and loan books combined with expanding fee-based businesses such as wealth management.
Even more striking was the turnaround in profitability; net income soared by approximately 171.5%, reaching $53.4 million for FY2025 compared with only around $19.6 million for FY2024 [F1]. This leap reflects successful integration cost management after an initial spike in merger-related expenses as well as improved net interest margins aided by scale and enhanced mix effects [S15][N7]. Operating cash flow also exhibited strong momentum, increasing by roughly 79.3% YoY to over $224 million [F1], underpinning healthy liquidity and investment capacity for future initiatives.
Interest rate fluctuations had previously posed challenges to earnings stability—a notable risk factor—but post-merger strategic asset rebalancing mitigated some acute exposure while positioning the firm favorably for an evolving rate environment [S6]. The company’s ability to leverage synergies without sacrificing credit discipline or customer relationships remains a core driver of its recent transformation.
Broadening Reach: Geographic Footprint and Business Line Diversification
Post-transaction, Beacon operates an extensive network of 147 full-service banking offices spread across key New England states including Massachusetts, Connecticut, Rhode Island, Vermont, as well as parts of New York [S1][S8]. The combination united Legacy Berkshire’s traditionally more rural deposit base with Legacy Brookline’s commercial lending emphasis focused on metropolitan centers like Boston and Albany [S11]. This duality offers both diversification benefits and opportunities for cross-selling a wide range of banking products.
The company provides comprehensive commercial banking services—such as lines of credit linked predominantly to prime or Federal Home Loan Bank (FHLB) indices—alongside retail banking including consumer loans, mortgage origination, cash management solutions, foreign exchange capabilities, online/mobile platforms, and equipment financing through subsidiaries like Eastern Funding [S8][S21]. Clarendon Private extends wealth management offerings to individuals and institutions enhancing non-interest income streams.
Deposit dynamics illustrate stable core deposit bases comprising about two-thirds of total deposits ($13.1 billion out of $19.5 billion total deposits), highlighting effective customer retention amidst competitive pressures [S16]. Brokered deposits have declined substantially as a percentage of total funding from nearly 10% down to just over 2%, signaling reliance on stickier funding sources [S16]. Moreover, reduced reliance on wholesale borrowings ($788 million vs prior $1.5 billion) further supports the strength of the deposit franchise bolstered by attractive product pricing linked to prevailing market conditions [S9][S16].
Beacon also enjoys significant borrowing capacity from FHLB Boston ($3.9 billion in qualifying collateral capacity) alongside access to federal discount window facilities (~$602 million available), ensuring multiple layers for liquidity management [S4][S9]. These facets underscore disciplined balance sheet management geared toward minimizing funding costs while supporting loan growth where profitable.
Profitability Reboot: Analyzing Key Q4 Results Versus Expectations
Recent quarterly earnings releases indicate Beacon outperformed Wall Street's Q4 estimates reported January 2026 [N1][N2][N7]. Positive drivers included sustained net interest income expansion aligned with management's scenario analyses predicting modest net interest margin improvement due partly to lower wholesale funding costs amid an upward-sloping yield curve environment [S6][N7].
Management highlighted an "asset sensitivity" level around 40%, indicating that approximately this proportion of assets reprices or matures faster relative to liabilities within key horizon periods – a position that balances repricing risk without overly exposing net interest spread to abrupt rate compressions [S6]. Commentary also stressed ongoing monitoring of deposit behaviors where customers could migrate toward non-deposit investment alternatives if rates fall sharply or competitive yields shift aggressively.
Non-interest expense carried elevated merger costs but did not offset gains derived from broader fee income contributions facilitated by the diversified commercial/retail business model [N7][S15]. Retail deposit patterns remained resilient during Q4 indicating solid customer engagement despite challenging macroeconomic conditions.
Forecasting Future Growth Amid Interest Rate Sensitivities
Looking ahead, Beacon’s trajectory will likely hinge on navigating complex interest rate environments compounded by credit risk considerations documented among principal risks facing the firm [S1][N4][N6]. Management’s balanced approach involves actively managing loan portfolio composition—including weighted average maturity adjustments—and promoting products tied closely to floating rates or shorter repricing horizons.
Loan originations are expected to sustain momentum particularly in commercial real estate segments where underwriting is tightly controlled via debt service coverage ratios and loan-to-value limits designed to mitigate downside exposures [S16][S18]. Deposit mix adjustments will continue responding dynamically to rate sets; higher yielding instruments may attract inflows but come with increased funding cost implications requiring constant vigilance [S6].
Analysts following Beacon should monitor periodic updates regarding net interest margin guidance embedded within interim disclosures as well as asset sensitivity shifts revealing how treasury strategies evolve relative to Federal Reserve policy moves; given the company’s blended fixed/floating portfolios these metrics will be crucial barometers for earnings outlooks absent explicit forward guidance [N4][S6].
Capital Allocation Focus: Returns, Dividends, and Buyback Trends
Beacon maintained consistent shareholder return policies during this transformative period anchored by stable quarterly dividends set at $0.3225 per share payable regularly—a distribution supporting steady income streams even as earnings recovery progressed [S3][N5][F1]. Dividend payments more than doubled from roughly $31 million in FY2024 to over $63 million allocated in FY2025 reflecting expanded earnings power alongside enhanced equity levels following the transaction [F1].
Return on equity (ROE) stood at about 2.1% based on reported FY2025 results juxtaposed against equity near $2.5 billion post-merger—levels that reflect both newly assumed capital bases as well as ongoing profitability improvements albeit not yet at peak industry benchmarks [F1][S15]. This ROE figure is consistent with early-stage re-investment phases where scaling efficiencies have yet fully matured.
Share repurchase activity eased substantially due to larger equity capitalization driven by acquired shares; buybacks dropped from over $23 million in FY2023 down toward $17 million program volumes recognized through FY2024 prior to merger close, signaling disciplined capital deployment focused first on integration needs followed by dividend safety nets [F1].[N5] Going forward incremental excess capital may unlock more aggressive repurchase strategies depending on earnings stabilization and regulatory constraints.
Liquidity and Capital Structure: Fortifying Financial Stability Post-Merger
Following the franchise combination event, Beacon boosted its cash & equivalents holdings sharply—more than tripling from approximately half a billion dollars at end-2024 up towards $2 billion (or ~16% of total assets)—a reflection both of assumed transactional payroll deposits inflows plus conservative liquidity posturing amid market uncertainty [F1][S4][S5]. Such elevated liquidity cushions enhance flexibility for lending activities while cushioning against potential funding shocks.
Total deposits ballooned from under $9 billion pre-transaction toward nearly $20 billion by December 31, 2025 underscoring broadening customer relationships feeding into reliable funding bases aligned mainly toward core deposits rather than volatile brokered alternatives [S16][F1]. Concurrently borrowed funds declined materially from over $1.5 billion down below $800 million illustrating proactive deleveraging afforded by ample deposit inflows converting costlier wholesale funding into stable retail-like sources contributing positively toward net interest margins [S9].
Capital ratios remain robust satisfying "well-capitalized" thresholds operationalized under Federal Reserve guidelines: Common Equity Tier 1 ratio improved modestly from ~10.46% pre-merger up slightly above 10.95%, Total risk-based capital rose above 13%, while leverage ratios were positioned near or above historically sound bands indicating ample buffer against credit or market shocks [S15]. Allowance coverage increased commensurate with portfolio growth reflecting conservative provisioning practices backed by detailed risk assessments including scenario analysis outputs fueling sound loan loss reserves covering heterogeneous commercial real estate exposures predominating portfolio composition [S18][S22].
Disclaimer: This report is prepared solely for informational purposes referencing publicly available data from SEC filings and reputable news outlets as cited herein. It does not constitute investment advice or recommendations. Readers are advised to perform their own due diligence before making any decisions related to securities mentioned herein.
Disclaimer: This is research-only, informational analysis and not investment advice. It may include AI-generated interpretation and general industry context. Always verify important details using primary sources.

Comments