
Citizens Community Bancorp Grows Net Income Modestly, Balances Liquidity and Capital Allocation
CZWI’s 2025 financials reflect steady net income growth, disciplined balance sheet management, and ongoing capital return to shareholders amid a competitive regional banking landscape.
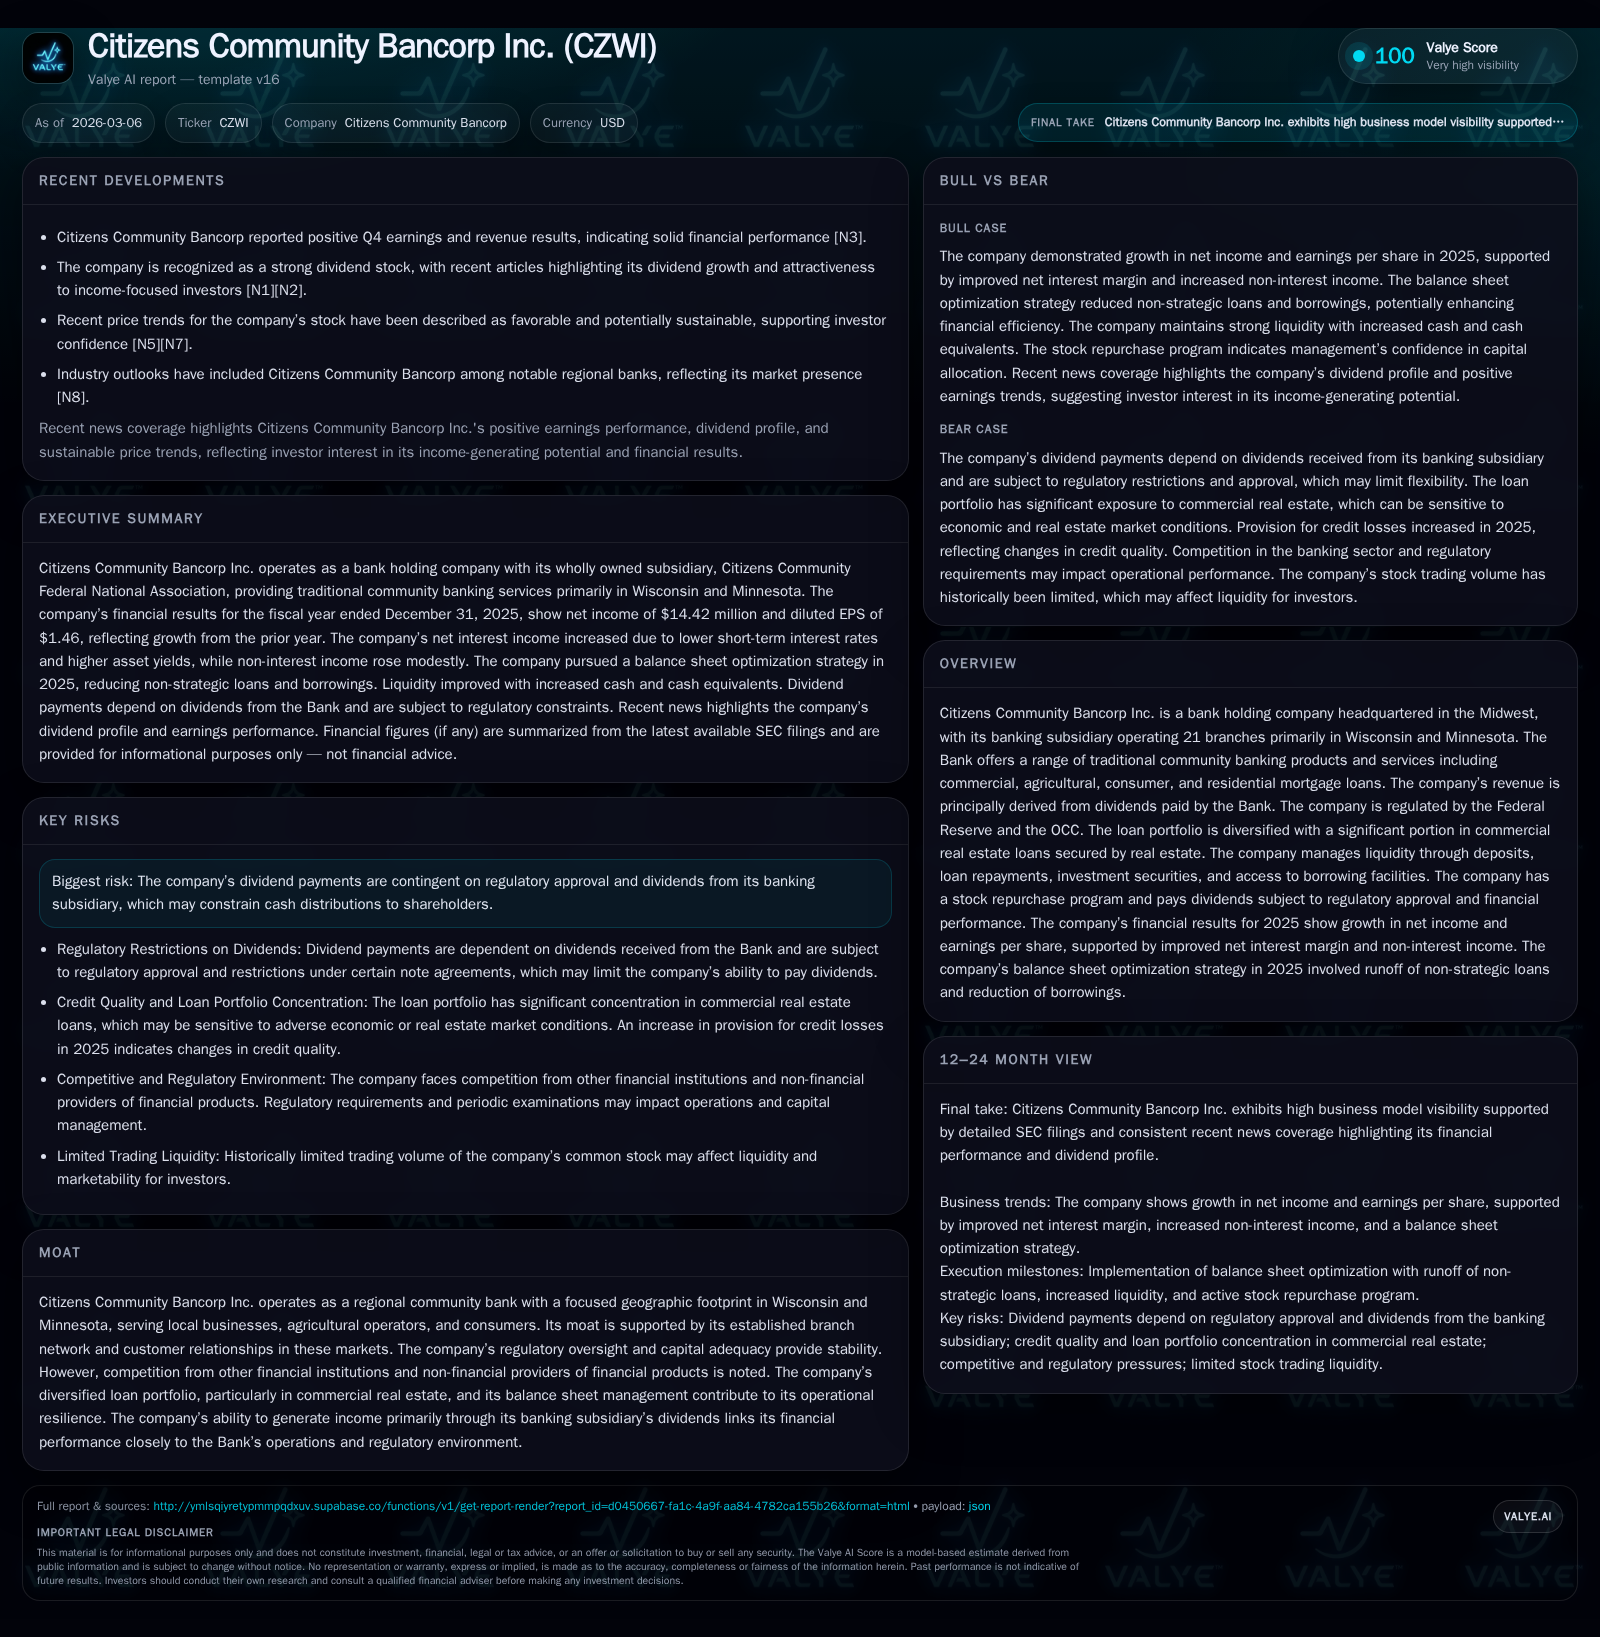
Citizens Community Bancorp Inc. reported a 4.9% increase in net income for fiscal year 2025 to $14.42 million, supported by its banking subsidiary’s dividend growth and stable core operations. The company maintains strong liquidity and capital adequacy, classified as well capitalized under regulatory guidelines, despite a decline in operating cash flow versus prior year. Deposits and equity increased, with ongoing share repurchases and dividend hikes reflecting continued commitment to shareholder returns. Loan portfolio optimization and diversification underpin operational resilience, though future dividend payments remain contingent on regulatory approvals.
Overview of Operations and Market Footprint
Citizens Community Bancorp Inc. operates as a bank holding company headquartered in the Midwest with a focused footprint primarily across Wisconsin and Minnesota through its banking subsidiary running 21 branches.[S23] The Bank serves a mix of customers including commercial businesses, agricultural operators, consumers, and residential mortgage clients. Its revenue is chiefly derived from dividends declared by its banking subsidiary.[S1]
The competitive environment includes other financial institutions and non-bank providers offering similar financial products within its regional markets.[S23] The firm’s moat is supported by established local relationships and regulatory capital strength.
Historical Financial Performance
Citizens Community Bancorp has shown steady improvement in net income over recent years with incremental gains reflective of disciplined operations.
Historical performance (annual)
| FY | Net ($mm) | CFO ($mm) | Capex ($mm) | Net YoY |
|---|---|---|---|---|
| 2025 | 14 | 12 | 1 | +4.9% |
| 2024 | 14 | 20 | 1 | +5.3% |
| 2023 | 13 | 13 | 1 | -26.5% |
| 2022 | 18 | 29 | 4 |
Source: SEC companyfacts cache [F1].
Capital returns and efficiency (annual)
| FY | Div ($mm) | Buybacks ($mm) | FCF ($mm) |
|---|---|---|---|
| 2025 | 6 | 10 | |
| 2024 | 3 | 6 | 19 |
| 2023 | 3 | 0 | 12 |
| 2022 | 3 | 2 | 26 |
Source: SEC companyfacts cache [F1].
Net income growth in fiscal year 2025 was driven primarily by an increase in dividend income received from the Bank subsidiary, which paid out $30.5 million compared to $18.75 million the prior year.[F1][S17]
Operating cash flows declined significantly by about 42% in part due to adjustments related to equity distributions from the Bank affecting consolidated cash flow measurement.[F1][S17] Capital expenditures rose moderately reflecting timing differences including amortization of intangible assets.[F1][S18]
The company's equity base expanded alongside retained earnings and other comprehensive income improvements, further strengthening capital ratios.[F1][S17]
Asset Quality and Loan Portfolio Composition
As of December 31, 2025, total loans outstanding decreased slightly to approximately $1.34 billion from roughly $1.37 billion the previous year.[S28] The loan portfolio remains weighted toward commercial real estate loans secured by real property (51%), with additional allocations to multi-family real estate (18%) and agricultural real estate (5%).[S28]
Credit quality metrics show criticized loans (special mention plus substandard) rose from $27 million at year-end 2024 to nearly $46 million at end-2025 due mainly to new multi-family loan additions partially offset by repayments.[S21] Management continues proactive loan review and maintains adequate allowance for credit losses consistent with industry practice.[S20][S26]
Deposit Base and Liquidity Position
Deposits grew approximately $36 million during the year ending December 31, 2025, reaching about $1.52 billion.[S15] Consumer deposits represented about 58%, commercial deposits roughly 28%, public deposits around twelve percent, with wholesale deposits minimal.[S15][S24]
The liquidity ratio — cash plus unpledged securities divided by total assets — improved from about 11.75% at December end-2024 to approximately 14.8% at December end-2025.[S4] This improvement was driven by reductions in investment portfolios combined with deposit growth.
Uninsured and uncollateralized deposits increased moderately but remain well covered by available liquidity sources including collateralized borrowings and federal funds lines providing over twice coverage relative to these liabilities.[S4][S15]
Capital Adequacy and Regulatory Status
Citizens Community Bancorp's bank subsidiary remains classified as "Well Capitalized" under regulatory Prompt Corrective Action guidelines across key capital ratios.
At December end-2025, Tier 1 capital stood at approximately $195 million representing about a 13.4% ratio of risk-weighted assets—well above regulatory minimums.[S29]
Recent refinancing actions included redeeming higher-coupon subordinated notes which reduced debt balances without adversely impacting liquidity or leverage metrics.[S9][S15]
Capital Allocation: Dividends and Share Repurchases
The Company increased its cash dividend by approximately +12.5% in early February of fiscal year ’25, paying $0.36 per share versus $0.32 previously.[F1][S10]
Dividend payments depend on receipt of dividends from the banking subsidiary plus obtaining regulatory approvals; this creates some uncertainty around future payouts if subsidiary earnings or regulatory conditions change materially.[S1][S10]
Share repurchases continued actively with about $6 million spent during fiscal year ’25 under a Board-authorized program designed for incremental buybacks supporting shareholder value.[F1][S7]
Growth Prospects and Challenges
Future growth prospects hinge on performance of the Bank’s regional loan book amid competitive pressures.
Management has been optimizing loan composition focusing on diversified commercial real estate lending while managing runoff of non-core exposures.[N1][N4]
Competition for deposits remains intense; efforts are underway to expand low-cost core deposits through new product offerings despite challenges posed by interest rate dynamics.[S4]
Regulatory oversight remains a key factor influencing dividend declarations given restrictions tied to subordinated note covenants or senior debt defaults that could limit payouts.[S10]
Operational Highlights Worth Monitoring
- Ongoing loan portfolio optimization balancing yield versus credit risk concentration.
- Shift toward more stable non-maturity deposit accounts enhancing funding stability.
- Active liquidity management through securities portfolio adjustments and borrowing facilities amidst market volatility.
- Regulatory developments impacting dividend eligibility.
- Execution pace and effectiveness of share repurchase programs relative to market conditions.
Summary Table: Key Financial Metrics (Years Ending Dec)
| Metric | FY22 | FY23 | FY24 | FY25 |
|---|---|---|---|---|
| Net Income ($M) | 17.76 | 13.06 | 13.75 | 14.42 |
| Operating Cash Flow ($M) | 29.29 | 13.12 | 20.18 | 11.69 |
| Capex ($M) | 3.60 | 1.37 | 0.89 | 1.31 |
| Dividends Paid ($M) | - | - | 3.35 | - |
| Share Repurchases ($M) | 1.76 | 0.42 | 6.10 | - |
| Equity ($M) | 167 | 173 | 179 | 188 |
Note: Dividends paid for FY25 not fully reported separately but referenced in narrative; net income growth reflects improving profitability tied closely to subsidiary performance; cash flow variations relate largely to equity accounting adjustments.
Disclaimer: This memo is based solely on public filings and news sources as of March 6th, 2026 without any endorsement or opinion on investment actions.
Disclaimer: This is research-only, informational analysis and not investment advice. It may include AI-generated interpretation and general industry context. Always verify important details using primary sources.
Comments