
Bloom Energy Surpasses Profitability Thresholds with Expanding Installation and Service Revenues
Q2 2026 results show a strong profitability turnaround driven by surging product sales and growing managed services, signaling operational leverage amid capital intensity.
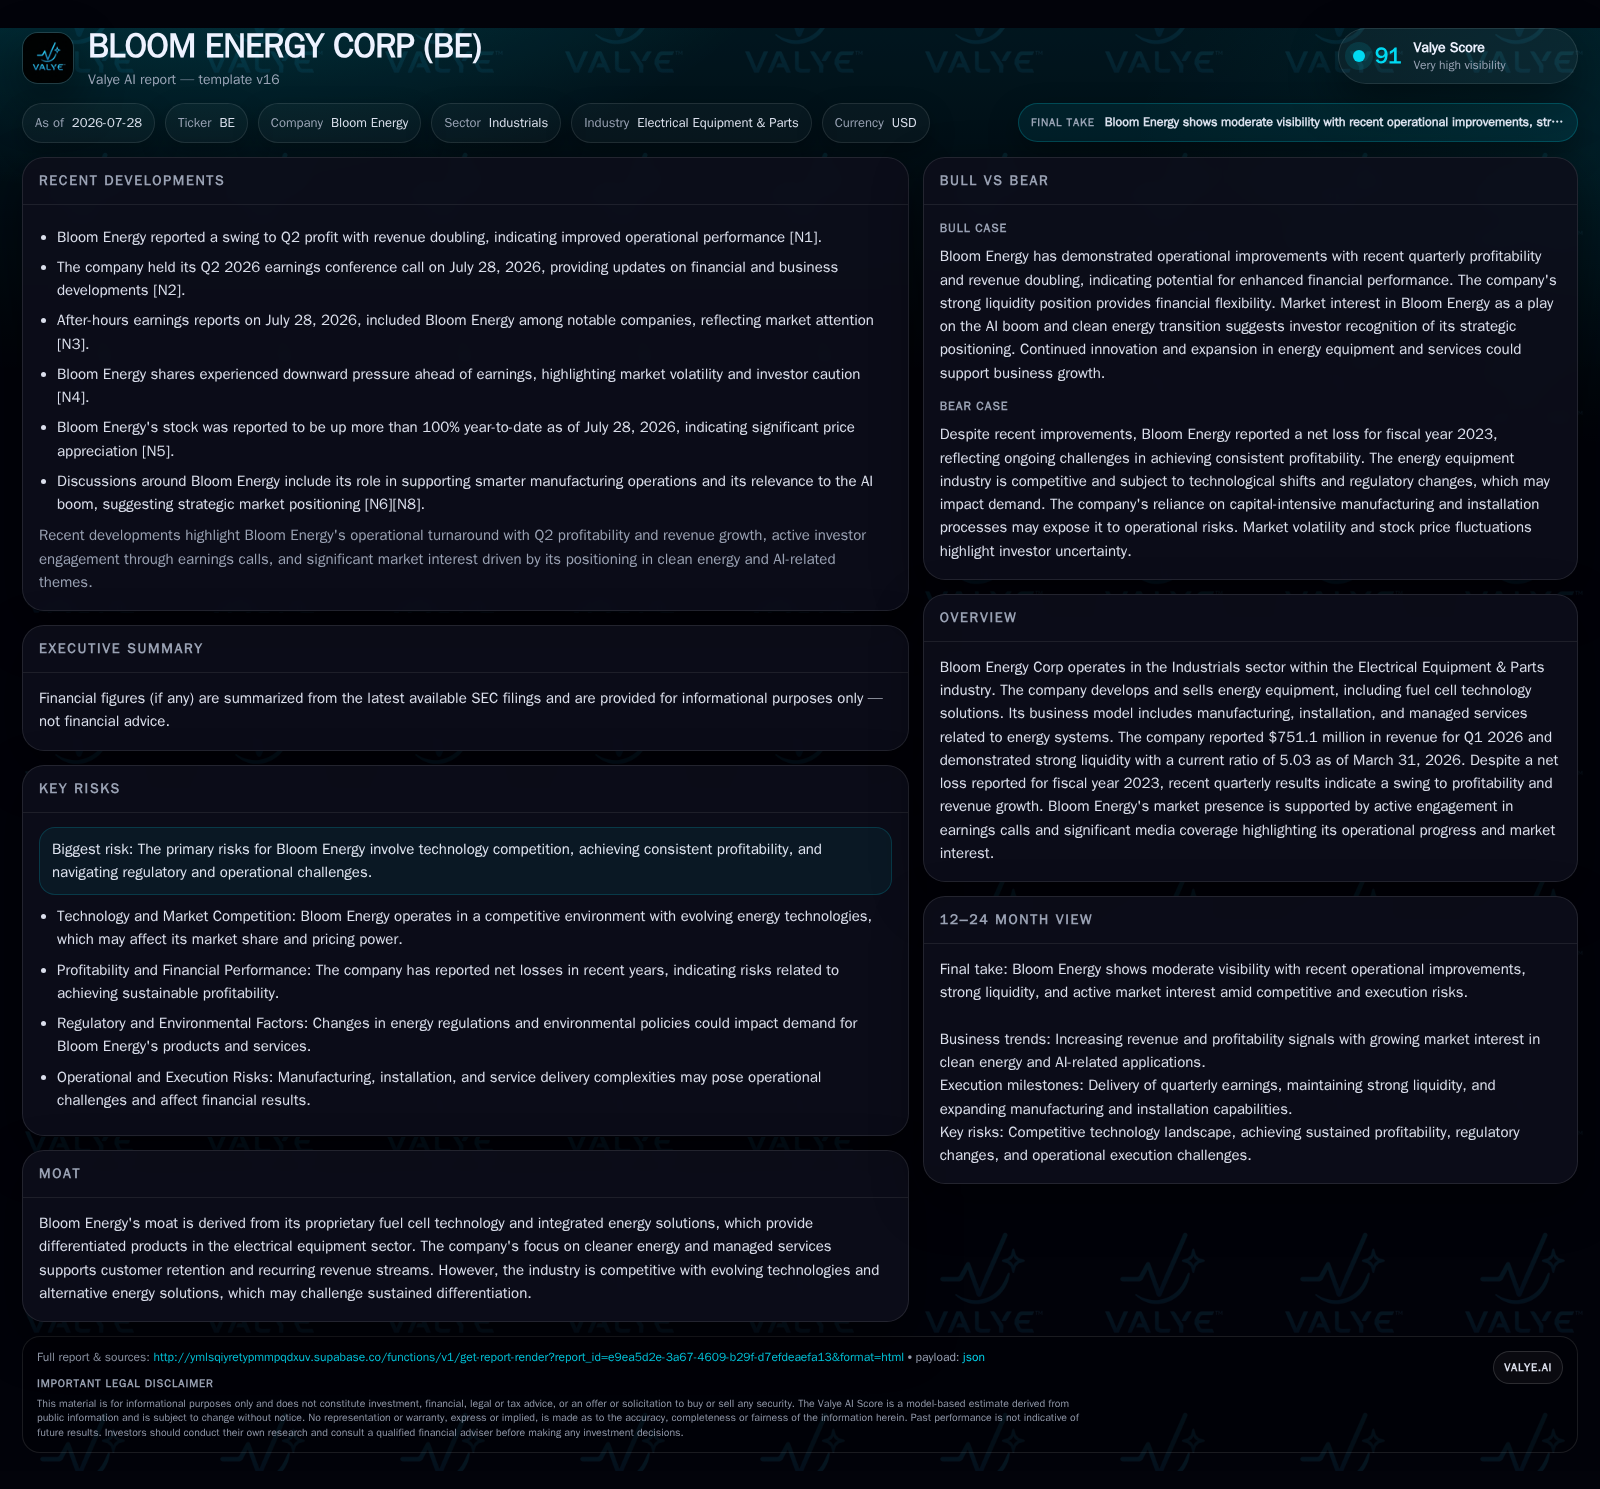
Bloom Energy's Q2 2026 filing reveals a marked inflection as total revenues more than double year-over-year, led by a sharp increase in fuel cell product sales alongside expanding installation and service revenues. The company reported net income of $272.5 million over the first half of 2026, reversing previous losses, indicating improving margin dynamics and operational scale. Recurring service contracts continue to build as installed base grows, providing greater revenue stability. Despite these gains, challenges related to capital intensity, supply chain, and competitive pressures remain visible headwinds.
Inflection Revealed: Q2 Earnings Highlight Revenue Surge and Profit Swing
This revenue mix shift signals operational leverage kicking in as higher sales volumes absorb fixed costs across Bloom’s manufacturing footprint and support broader deployment capacity expansion.
Fuel Cells at the Core: Dissecting Bloom's Capital Equipment Sales Drivers
At the heart of Bloom Energy’s growth is its proprietary fuel cell technology — specialized electrical apparatus designed for distributed power generation that serves commercial, industrial, and utility customers transitioning toward cleaner energy sources [S1]. The company categorizes these systems as high-value capital equipment whose sale forms the bulk of product revenue growth.
While product sales surged substantially this quarter, they inherently carry high manufacturing costs due to complex materials and precision engineering requirements characteristic of fuel cell systems. Nonetheless, increased volumes enable scaling benefits that help improve gross margins.
Peers such as Plug Power and FuelCell Energy provide useful benchmarks; both face similar tradeoffs balancing technological innovation-driven product differentiation with capital-intensive production processes impacting near-term profitability profiles [S1]. Bloom’s ability to steadily grow its backlog here is a critical indicator of market acceptance and future revenue visibility.
Managed Services Growth: A Path Toward Recurring Revenue Stability
Complementing product sales are installation services and increasingly important managed services that create recurring revenue streams while enhancing customer retention.
Bloom’s instalment revenues climbed modestly alongside system deployments — growing installation capacity remains essential given long sales-to-install cycles typical in this industry segment — while service revenue grew markedly from $54.4 million to $69.0 million quarter-over-quarter as an expanded installed base drives maintenance contract renewals and ongoing support obligations [S2], [S1].
This transition toward a larger share of recurring managed service contracts aligns with wider industry trends where stable cash flows from service agreements reduce exposure to longer project sales cycles and upfront capital spending volatility.
Customer retention rates tied to these contracts serve as compelling KPIs for evaluating underlying demand durability.
Competitive Forces and Industry Dynamics Shaping Market Positioning
Despite recent financial improvements, Bloom Energy operates within an intensely competitive landscape marked by rapid technological evolution in clean energy systems integration.
Competition stems not only from traditional industrial electrical equipment manufacturers but also from innovative renewable energy system integrators offering alternative distributed generation solutions that may challenge Bloom's technology moat unless continuous innovation sustains differentiation [S1].
Moreover, persistent dependency on supportive regulatory frameworks and government incentives poses risks; any weakening or restructuring of policies could materially impact customer adoption rates given the sector’s capital-intensive investment profile.
Comparisons between industrial-capex-heavy players like Siemens Energy or General Electric highlight scale-related margin pressures amid competitive installation cost dynamics.
Growth Catalysts: Regulatory Tailwinds and Technology Advances Driving Demand
The core drivers underpinning Bloom’s recent momentum include regulatory support favoring cleaner energy adoption alongside broad shifts in industrial electrification and infrastructure modernization.
Legislative initiatives such as renewable energy credits and investment tax incentives increase economic attractiveness for fuel cell power generation systems among utilities and large corporates focused on sustainability commitments [S1], [N1].
Technological enhancements improving fuel cell operating efficiency further bolster Bloom's value proposition by reducing lifetime costs compared to fossil-based alternatives.[S1]
These factors collectively contribute to anticipated long-term installed base expansion essential for scaling both product sales and subsequent service contract revenues.
Constraints Ahead: Capital Intensity, Execution Risk, and Market Competition Watchpoints
Nevertheless, challenges loom that could constrain sustained profitability gains or growth acceleration.
Capital intensity remains an inherent constraint due to complex manufacturing requirements for fuel cells combined with substantial upfront R&D investments necessary to maintain technology leadership.[S1] Supply chain fragility for critical components further amplifies execution risk around meeting ramped installation schedules efficiently.[S2]
Additionally, lengthier sales cycles typical in utility-scale projects cause lag between order intake and recognized revenue impacting near-term cash flow visibility [S1]
Margin compression scenarios could arise if competitive pricing pressures intensify or regulatory incentives fluctuate unfavorably.
These risks underscore the importance of cost control discipline alongside continued innovation investment.
"What Comes Next": Key Milestones and Signals to Monitor in Upcoming Quarters
Looking forward, several indicators should be closely tracked to assess whether Bloom Energy can sustain this positive trajectory.
Quarterly updates on contract backlog levels will reveal demand momentum consistency beyond spike quarters.[S3] Managed services contract renewals and installed base growth metrics will serve as leading indicators for recurring revenue stability.[N3]
Margin progression trends, particularly gross margin improvement tied to manufacturing scale-out effectiveness will confirm operational leverage sustainability [S3]
Finally, any guidance adjustments or commentary linked to supply chain resolution efforts will be critical execution markers informing potential upside or downside risks.
Financial Profile Discussion: Cash Position, Leverage, Profitability Trajectory
As of March 31, 2026, Bloom Energy held approximately $2.49 billion in cash and equivalents against total debt of about $2.66 billion, resulting in net debt near $169 million [F1]. The company’s current ratio stood at an impressive 5.03x, indicating strong coverage of near-term liabilities
This liquidity position supports ongoing capital investments needed for manufacturing scaling without immediate refinancing concerns despite underlying sector capital intensity challenges.
The shift to net profitability year-to-date driven by expanding top-line volumes enhances Bloom's credit profile by reducing reliance on external funding while improving free cash flow generation prospects if cost efficiencies persist [S2]
In sum, while still navigating structural industry headwinds such as elongated sales cycles and competitive technology disruption risks,[S1] Bloom Energy's recent operational results place it on firmer footing with meaningful evidence of sustainable growth vectors anchored in its integrated fuel cell equipment sales coupled with growing recurring service revenues—a combination critical for navigating the evolving electrical equipment landscape.
Disclaimer: This is research-only, informational analysis and not investment advice. It may include AI-generated interpretation and general industry context. Always verify important details using primary sources.

Comments