
Biofrontera’s Q2 Surge Tests Sustainability of Growth Amid Steady Losses
Biofrontera's latest quarterly results reveal significant revenue growth alongside persistent operating deficits, highlighting a complex path toward profitability in dermatologic therapeutics.
In its August 2026 quarter, Biofrontera Inc. reported a 33% increase in revenue, signaling strengthening market adoption of its dermatological products. However, the company continues to face substantial net losses, reflecting elevated R&D and operating expenses characteristic of specialty pharmaceuticals balancing commercialization with pipeline advancement. Despite modest cash reserves and a current ratio just above 1, Biofrontera manages ongoing liquidity pressures while pursuing regulatory milestones and expanding product sales. The emerging growth company remains exposed to typical dermatology biotech risks including reimbursement challenges, competitive dynamics, and regulatory uncertainties.
Q2 2026 Results Spotlight Growth vs. Loss Balance
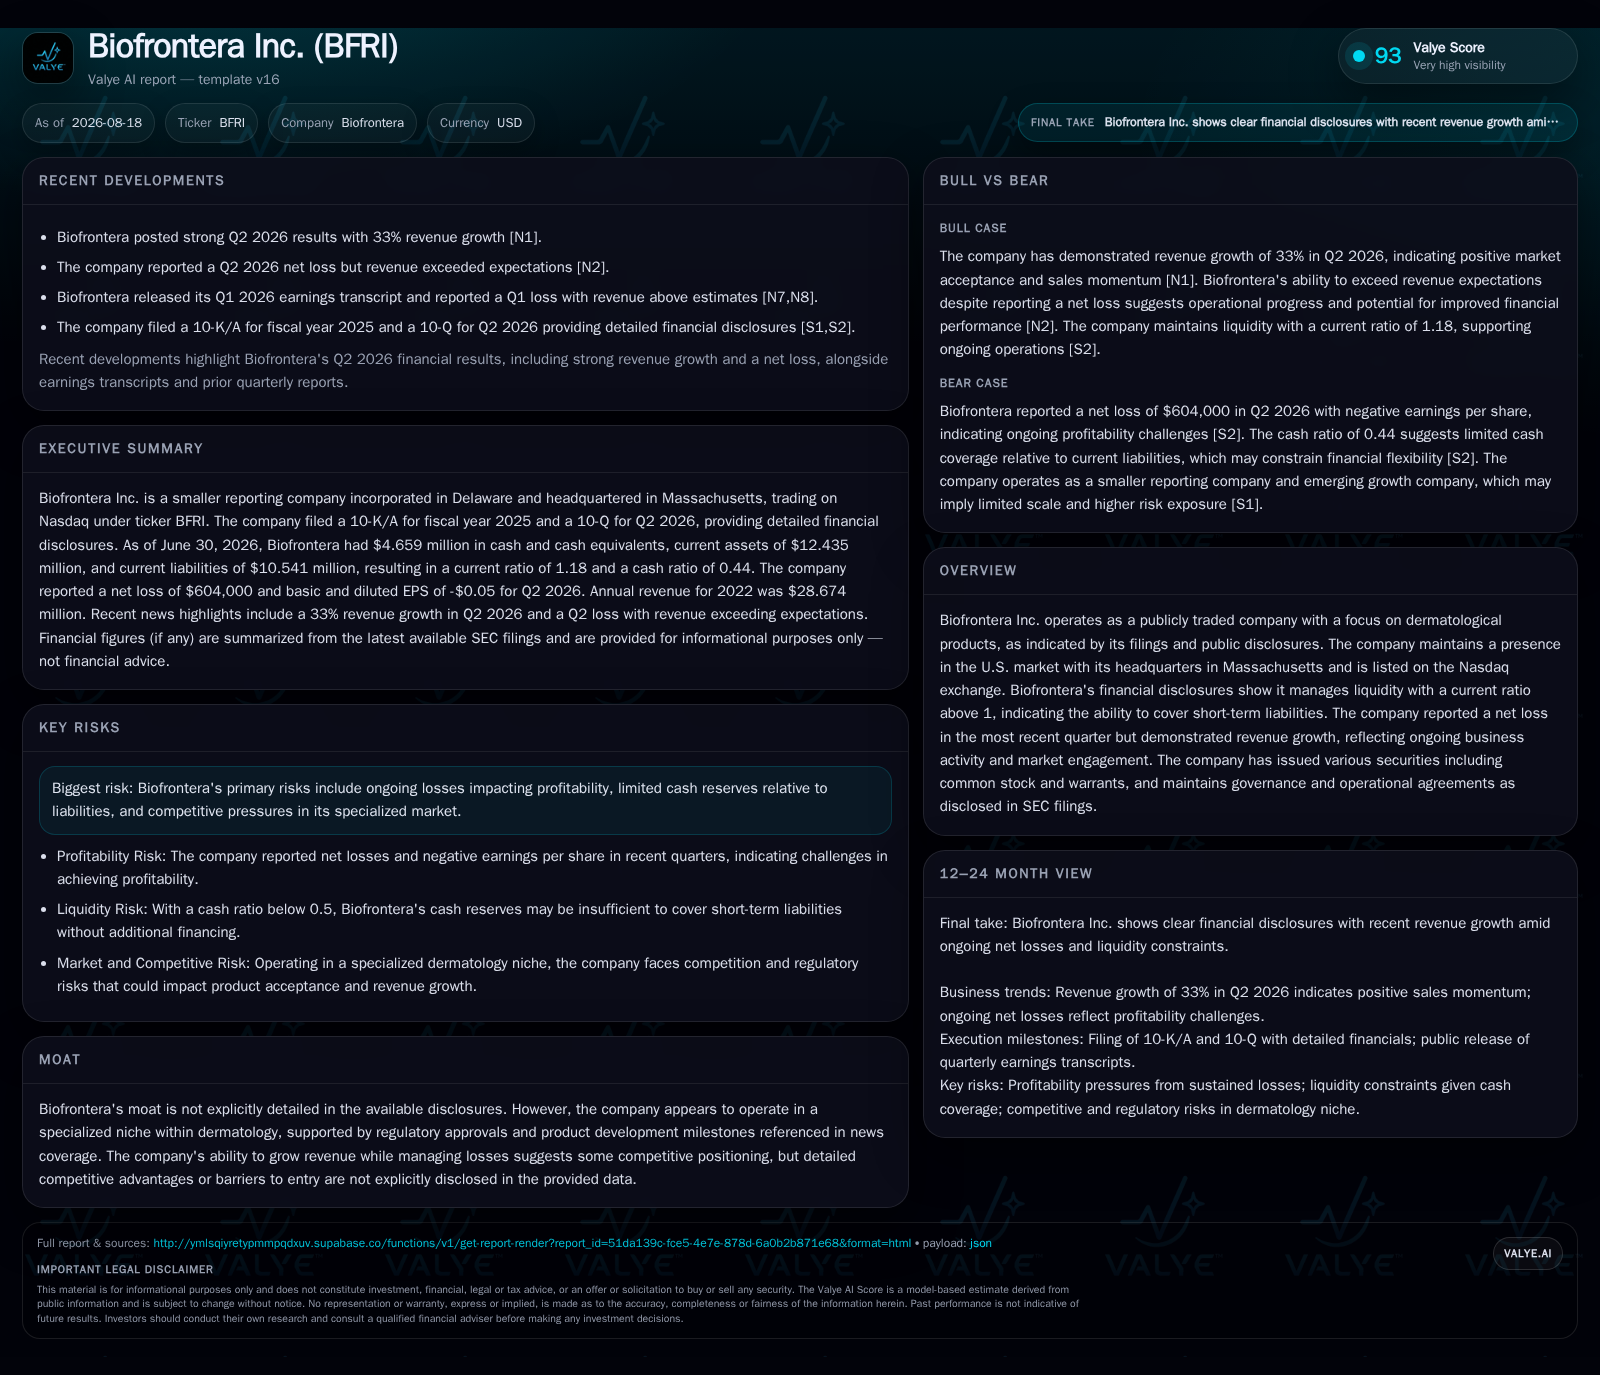
Biofrontera Inc.'s second quarter of 2026 demonstrated compelling revenue momentum with a reported 33% increase over the previous year’s comparable period, reaching approximately $28.7 million in top-line sales as disclosed in the August 13 filings and corroborated by Nasdaq reports [S2], [N1]. This acceleration highlights effective commercialization activity for its dermatologic therapeutic products within competitive specialty pharmaceutical channels. Yet despite this promising top-line trajectory, the company reported persistent net losses consistent with ongoing investments in research and commercial scalability. The pressure on profitability stems largely from elevated research and development (R&D) costs necessary to advance pipeline candidates and expand approved indications alongside maintaining market presence [S3], [F1]. This juxtaposition underscores Biofrontera's position at a critical inflection point—balancing growing product adoption against the inherent cash consumption characteristic of specialty pharma firms scaling their dermatology franchises.
Structured Revenue Streams Driven by Dermatologic Product Commercialization
Biofrontera’s business model is strategically anchored on the commercialization of proprietary dermatological therapeutics that have achieved necessary regulatory approvals for marketing primarily in the United States [S1]. Revenue generation flows predominantly from direct product sales facilitated through established supply agreements which provide a degree of revenue predictability and contractual stability vital for specialty pharma companies facing volatile demand cycles. These supply arrangements not only buffer revenue visibility but also play an integral role in logistics and distribution efficiency within dermatology-focused channels. Furthermore, sustained R&D expenditure supports continuous pipeline development aimed at securing label expansions or new indications—critical levers for future top-line growth but contributing to near-term operating losses due to upfront spending prior to commercial returns [S1], [S2], [F1]. The convergence of product commercialization efforts with structured supply frameworks equips Biofrontera to capitalize on emerging market opportunities while navigating typical sector challenges such as reimbursement negotiations and physician adoption hurdles.
Competitive Landscape: Positioning during Specialty Pharma Peers with FDA Approvals
Within the dermatology biotechnology segment, Biofrontera navigates a landscape populated by specialty pharmaceutical peers managing FDA-approved products alongside active development pipelines. While direct competitor comparisons are limited by available disclosures, publicly traded firms such as DermTech or Cara Therapeutics reflect similar operational profiles balancing sustained operating losses against incremental revenue growth afforded by product launches and supply agreements. Competitive positioning hinges substantially on regulatory status—FDA approvals confer market access but require continuous investment to defend pricing power amid reimbursement constraints and competition from generics or alternative therapies.
Market dynamics further emphasize physician acceptance and patient adherence as pivotal factors influencing product uptake rates. Pricing strategies must align with insurance reimbursement frameworks to avoid volume erosion while integrating advances in treatment modalities remains a vital differentiator in an increasingly crowded therapeutic category. Biofrontera’s ability to maintain revenue growth despite ongoing losses suggests some traction within these dynamics but also signals persistent vulnerability typical for emerging specialty biotech entities.
Pipeline Advancement and R&D Efficiency as Future Growth Catalysts
Future growth for Biofrontera is inherently tied to its pipeline progression through clinical trials and associated regulatory milestones. As of mid-2026 filings, the firm continues investing substantial resources into R&D programs critical for expanding the therapeutic scope of existing products or introducing novel dermatological solutions [S2], [F1]. Relative R&D expense levels remain significant compared to revenues—a common hallmark among clinical-stage or specialty-focused biopharmaceutical developers striving to move beyond proof-of-concept towards commercialization.
Successes in these endeavors would catalyze medium- to long-term value creation by enhancing product portfolios and enabling access to broader markets via label extensions or new indications. However, the extended timelines customary for clinical trials coupled with regulatory uncertainties impose risks that may prolong operating deficits before meaningful positive cash flows ensue. Monitoring enrollment rates, trial completions, and milestone announcements will be instrumental in assessing efficiency gains or setbacks within this developmental vector.
Key Risks: Cash Runway, Regulatory Uncertainties, and Competitive Pressures
The balance sheet snapshot reveals constrained liquidity resources; cash and equivalents totaled approximately $4.7 million at June 30, 2026 with current assets just exceeding current liabilities by an estimated factor of 1.18—the latter indicating limited but positive short-term financial flexibility [F1]. Limited cash reserves present potential constraints on fully funding R&D pursuits or scaling commercial operations without additional financing steps.
Regulatory risk is amplified by ongoing patent litigation involving Sun Pharmaceutical Industries and evolving patent claim challenges which could impact exclusivity or competitive positioning if unfavorable resolutions occur [S26]. Additionally, reimbursement environment volatility poses threats to pricing models critical for specialty pharmaceuticals reliant on favorable insurance coverage decisions to maintain volume sell-through.
Competitive intensity from both branded innovations and generics further elevates risk; any delay or failure in clinical programs could exacerbate capital needs or undermine investor confidence given persistent operating losses. These factors collectively underscore cautious scrutiny around liquidity management alongside execution capabilities on product launches and pipeline maturation.
What to Watch: Upcoming Milestones for Adoption, Regulatory Outcomes, and Liquidity Management
Investor focus should pivot towards near-term signals confirming sustainable momentum in both commercial uptake post-Q2 growth acceleration as well as tangible progress in regulatory filings or trial readouts that shape pipeline visibility [S2], [S3]. Signs of expanded reimbursement inclusion or enhanced physician adoption would support revenue durability.
Equally important will be monitoring quarterly burn rates relative to existing cash balances; any indications necessitating capital raises could influence valuation dynamics due to dilution concerns intrinsic to smaller emerging growth companies. Litigation developments around patent challenges remain a key watchpoint given material uncertainty currently evident.
Financial Profile Discussion: Liquidity Cushion Supports Growth Journey Despite Ongoing Losses
As of June 30, 2026, Biofrontera held $4.7 million in cash equivalents complemented by current assets totaling approximately $12.4 million against current liabilities near $10.5 million—yielding a current ratio modestly above one at 1.18 that conveys moderate capacity to meet short-term obligations without distress [F1]. This liquidity posture affords some runway for continued operating investments but leaves limited margins if operating losses accelerate.
Total debt remains minimal relative to cash holdings, indicating manageable leverage though operational performance heavily influences refinancing flexibility given net loss trajectories recorded through December 31, 2025 (net loss of about $10.5 million) along with operating income deficits exceeding $11 million during that period [F1]. Effective capital allocation decisions coupled with prudent expense controls will be pivotal as Biofrontera seeks to bridge current loss positions towards eventual profitability supported by expanding commercial revenues.
This analysis synthesizes Biofrontera's recent quarterly disclosures blended with sector context relevant to dermatology biotech firms navigating commercialization amid developmental expenses. All facts are based solely on cited SEC filings () and company-reported numeric data ([F1]), complemented by industry knowledge frameworks without speculative extrapolations or investment research views.
Disclaimer: This is research-only, informational analysis and not investment advice. It may include AI-generated interpretation and general industry context. Always verify important details using primary sources.

Comments