
Bank of New York Mellon’s Scale and Diversification Drive 2025 Revenue Growth Amid Intense Competition
BNY Mellon leverages its massive AUC/AUM base and diversified service mix to sustain growth and capital returns.
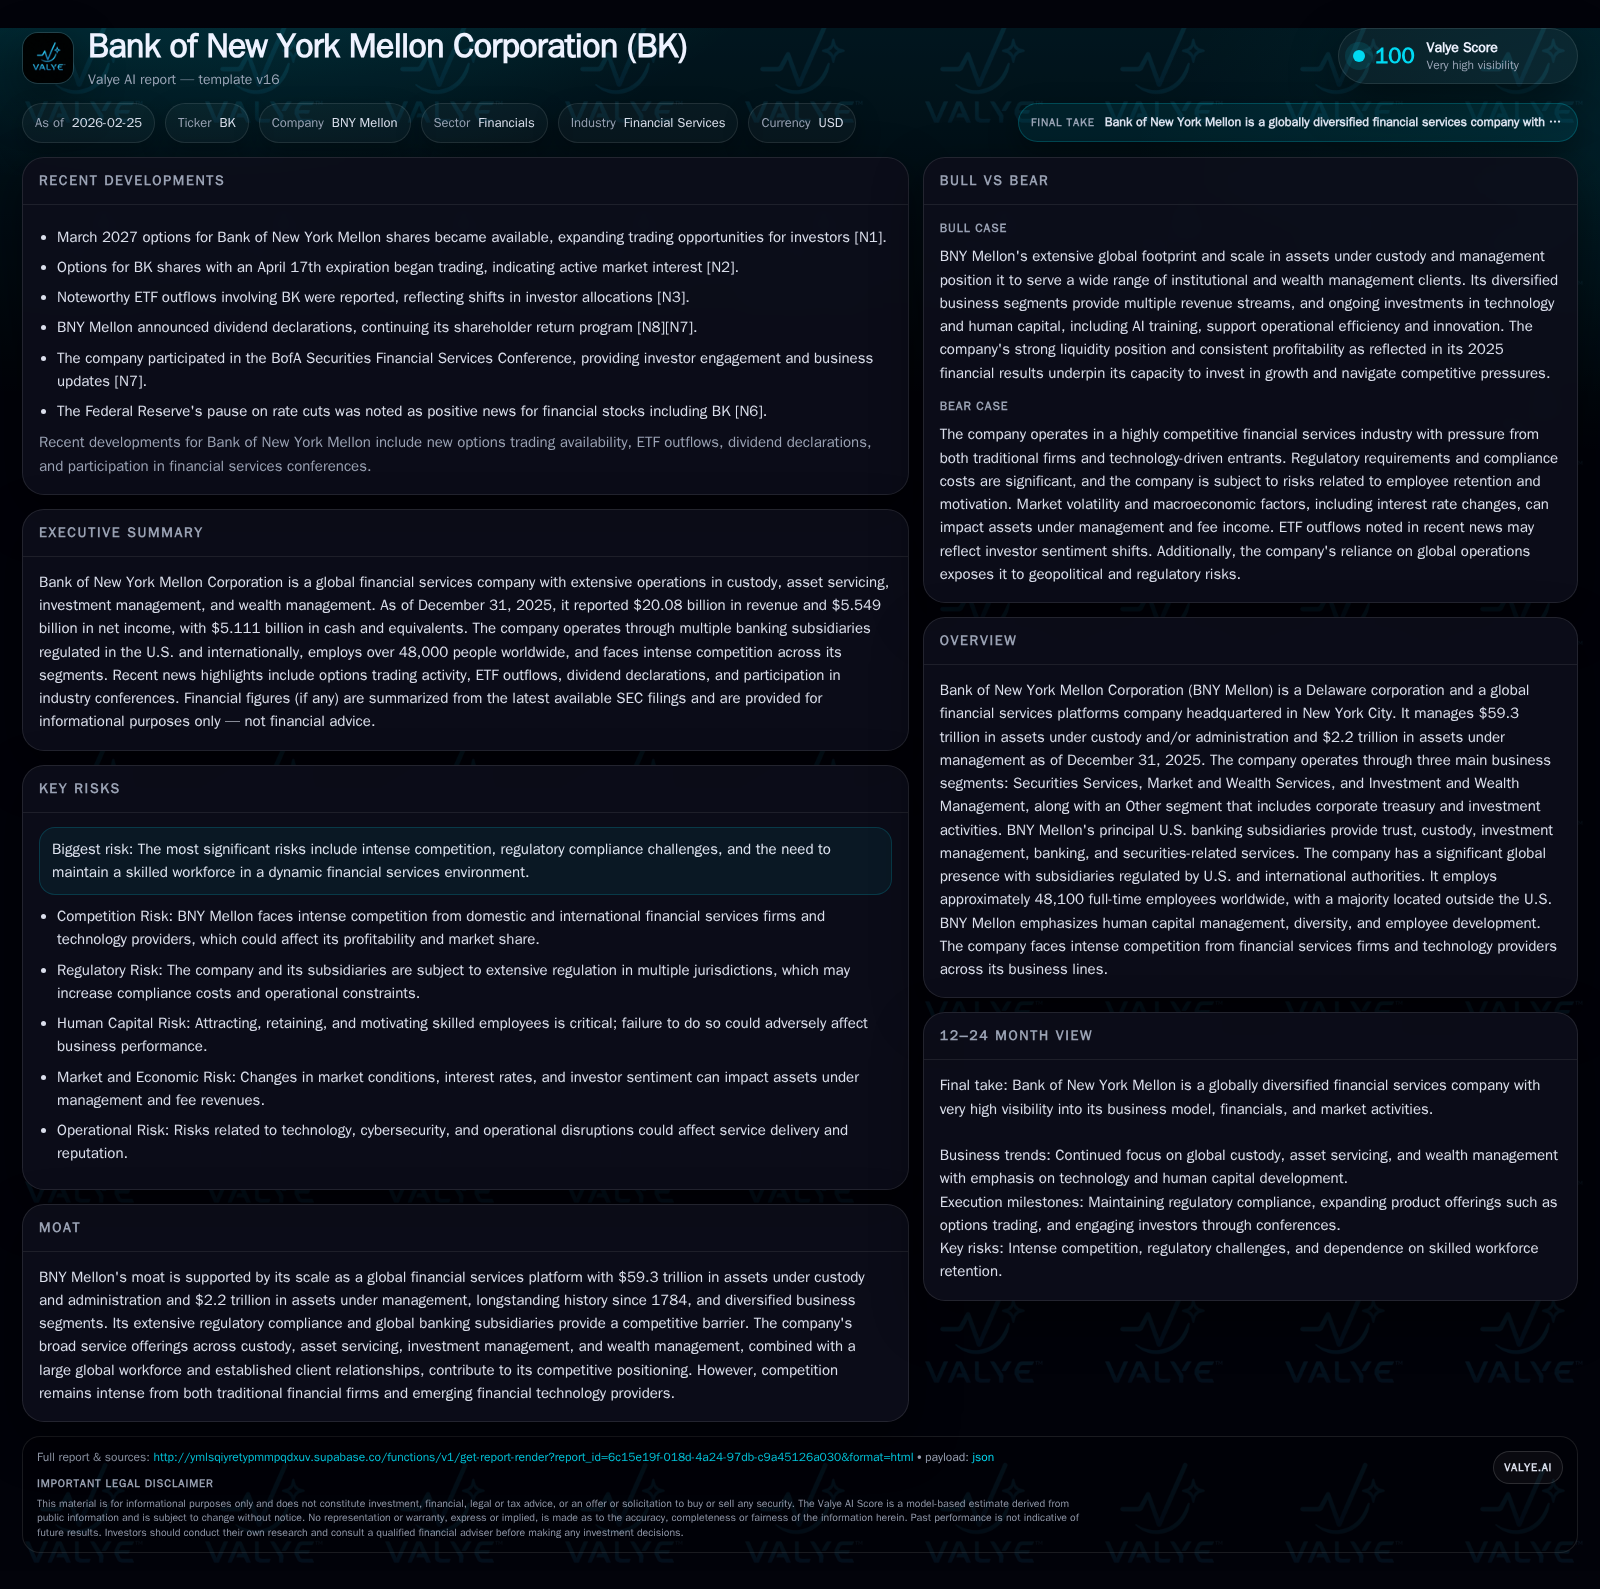
BNY Mellon Corporation reported solid growth in 2025, with revenues reaching $20.1 billion, up 7.8% year-over-year, driven by its global custody and asset management platforms managing $59.3 trillion in assets under custody and administration (AUC/A) and $2.2 trillion in assets under management (AUM). The company benefits from a diversified business model comprising Securities Services, Market and Wealth Services, and Investment and Wealth Management segments. Despite regulatory challenges and competitive pressures from fintech entrants, BNY Mellon’s scale and longstanding client relationships underpin its moat. Strong free cash flow generation supports ongoing dividend increases and significant share repurchases. Going forward, growth hinges on macroeconomic environment impacts on fee income through market valuations, active asset flows, and technology investments that enhance operational efficiencies.
Company Overview and Historical Performance
The Bank of New York Mellon Corporation (NYSE: BK), a Delaware corporation headquartered in New York City, stands as one of the largest global financial services firms specializing in asset servicing, custody banking, wealth management, and investment management. Founded in 1784, BNY Mellon has developed a commanding presence with $59.3 trillion in assets under custody or administration (AUC/A) and $2.2 trillion in assets under management (AUM) as of December 31, 2025 [S1][F1].
BNY Mellon's business is segmented into three core areas: Securities Services (which includes Asset Servicing and Issuer Services), Market and Wealth Services (covering Payments & Trade, Clearance & Collateral Management), and Investment & Wealth Management. An “Other” segment captures corporate treasury activities including securities portfolios as well as tax credit investments [S1].
The firm operates numerous U.S.-based banking subsidiaries regulated by various authorities such as the Federal Reserve and FDIC with deposits insured accordingly [S1]. Its global footprint includes lending arms abroad regulated by non-U.S. authorities.
Financial Performance Summary (FY2022-FY2025)
Historical performance (annual)
| FY | Rev ($bn) | Net ($bn) | CFO ($bn) | Capex ($mm) | Rev YoY | Net YoY |
|---|---|---|---|---|---|---|
| 2025 | 20.1 | 5.5 | 6.7 | 1553 | +7.8% | +22.5% |
| 2024 | 18.6 | 4.5 | 0.7 | 1469 | +6.4% | +37.9% |
| 2023 | 17.5 | 3.3 | 5.9 | 1220 | +6.9% | +27.7% |
| 2022 | 16.4 | 2.6 | 15.1 | 1346 |
Note: Omitted columns lack sufficient annual XBRL coverage in the provided tags (need ≥2 annual points): OpInc. Source: SEC companyfacts cache [F1].
Capital returns and efficiency (annual)
| FY | Div ($mm) | Buybacks ($bn) | FCF ($bn) |
|---|---|---|---|
| 2025 | 1447 | 3.5 | 5.2 |
| 2024 | 1348 | 3.1 | -0.8 |
| 2023 | 1262 | 2.6 | 4.7 |
| 2022 | 1165 | 0.1 | 13.7 |
Source: SEC companyfacts cache [F1].
Note: Operating income unavailable; CFO refers to net cash provided by operating activities; Dividends are payments on common stock; Buybacks represent repurchase of common stock [F1].
Historical Growth Drivers
BNY Mellon's revenue growth over the past four years has been supported largely by its dominant position as a custodian bank managing an enormous universe of assets globally across institutional investors such as asset managers, pension funds, endowments, financial institutions, and corporations [S1]. Growth in assets under custody helps drive fee income based on AUC/A values and transaction volumes.
Diversification into wealth services has broadened revenue sources beyond traditional custody fees into payments processing, collateral management, clearance activities as well as fee-generating investment advisory & wealth management mandates [S1]. These multi-pronged lines allow some resiliency against volatility in capital markets which affect asset valuations.
The company’s steady investment in technology infrastructure to automate manual processes, improve data analytics capability, and enhance cybersecurity protections underpin operational efficiency gains that support margin improvement despite competitive fee pressure [N1].
Competitive Moat Analysis
BNY Mellon’s moat stems from its unparalleled scale — custodying nearly $60 trillion — which provides pricing power through the network effect and high switching costs for clients contemplating alternative providers . Its long history since the late eighteenth century adds trust intangible valuable for fiduciary services.
Regulatory compliance is complex given the global reach spanning numerous jurisdictions, imposing significant fixed costs but also acting as barrier-to-entry for smaller rivals lacking broad licensing or capital adequacy [S9].
However, fintech entrants leveraging cloud native architectures seek to unbundle legacy custody and asset servicing solutions offering streamlined platforms at lower cost . Competition from other custodian banks like State Street or JPMorgan Chase remains fierce particularly targeting technology upgrades or cross-selling ability.
Future Growth Prospects
Growth opportunities center largely on continued expansion of assets under custody/administration which benefit from rising global wealth demographics albeit subject to market cycles that affect valuation-based fees [N2][S1]. Fees tied to trade volumes are sensitive to macroeconomic conditions influencing trading activity levels.
Investment & Wealth Management segment can grow via inflows into actively managed or passive products supported by digital advisory capabilities enhanced by AI/ML tools [N12].
Further international expansion especially in emerging markets could unlock incremental mandates but introduces additional regulatory complexity [S1].
Key risks dampening growth include:
- Fee compression due to intense price competition.
- Regulatory changes raising compliance costs.
- Market volatility affecting asset values directly impacting revenue.
- Disintermediation risk from fintech innovation reducing custodial reliance.
Capital Allocation & Returns Profile
BNY Mellon generated approximately $6.73 billion cash flow from operations in FY2025 up from an anomalously low $0.69 billion in FY2024 likely influenced by working capital timing given typical stability over longer periods [F1]. Capital expenditure outlays are consistently modest at ~7-8% of revenue as the company focuses on incremental tech upgrades rather than heavy physical infrastructure.
Free cash flow approximates $5.18 billion for FY2025 after capex deduction — ample liquidity enabling aggressive capital return programs including dividends totaling about $1.45 billion representing roughly a quarter of net income paid out last year [F1][N13]. Share repurchases have accelerated sharply reaching $3.54 billion in FY2025 constituting a meaningful percentage of outstanding shares enhancing EPS metrics over time [F1].
Approximate return on equity metrics hover around a healthy mid-teens level (~12-13%) reflecting steady profit generation on a substantial equity base exceeding $44 billion by end-2025 [F1]. The business model's strong cash conversion rates enable both internal investments for growth initiatives as well as shareholder returns.
What To Watch Next / Analyst Focus Areas (Analysis)
- Trajectory of total assets under custody/administration amid fluctuating markets.
- Fee rate trends especially within Securities Services where scale matters most.
- Momentum or setbacks in acquiring new wealth management clients or mandates.
- Ongoing technology investments intended to counteract fintech disruption while controlling costs.
- Regulatory developments impacting global operations or capital requirements.
- Dividend policy shifts or share buyback pacing indicating management confidence.
- Credit quality metrics within loan portfolios tied to wealth management mortgages or commercial loans given macroeconomic uncertainties.
Conclusion
Bank of New York Mellon remains a cornerstone institution within global financial infrastructure marked by immense scale in custody assets coupled with diversified service offerings spanning asset servicing to advisory functions. Historical financials illustrate strong double-digit net income growth powered by auxiliary cash flows supporting shareholder returns through dividends and buybacks.
Looking forward into the uncertain macroeconomic landscape shaped by interest rate dynamics, market volatility, regulatory evolution, and fintech competition, BNY Mellon's durability will depend heavily on continuing innovation within its technology stack while reinforcing competitive pricing through unrivaled scale advantages.[S9][N1]
This analysis is provided for informational purposes only without any endorsement or investment advice regarding Bank of New York Mellon Corporation or any securities mentioned herein.
Disclaimer: This is research-only, informational analysis and not investment advice. It may include AI-generated interpretation and general industry context. Always verify important details using primary sources.

Comments