
Bank of Marin Bancorp Rebounds with Improved Q1 Profit and Strengthened NIM
Q1 2026 sees Bank of Marin reversing prior losses, supported by net interest margin expansion and deposit dynamics within its Northern California stronghold.
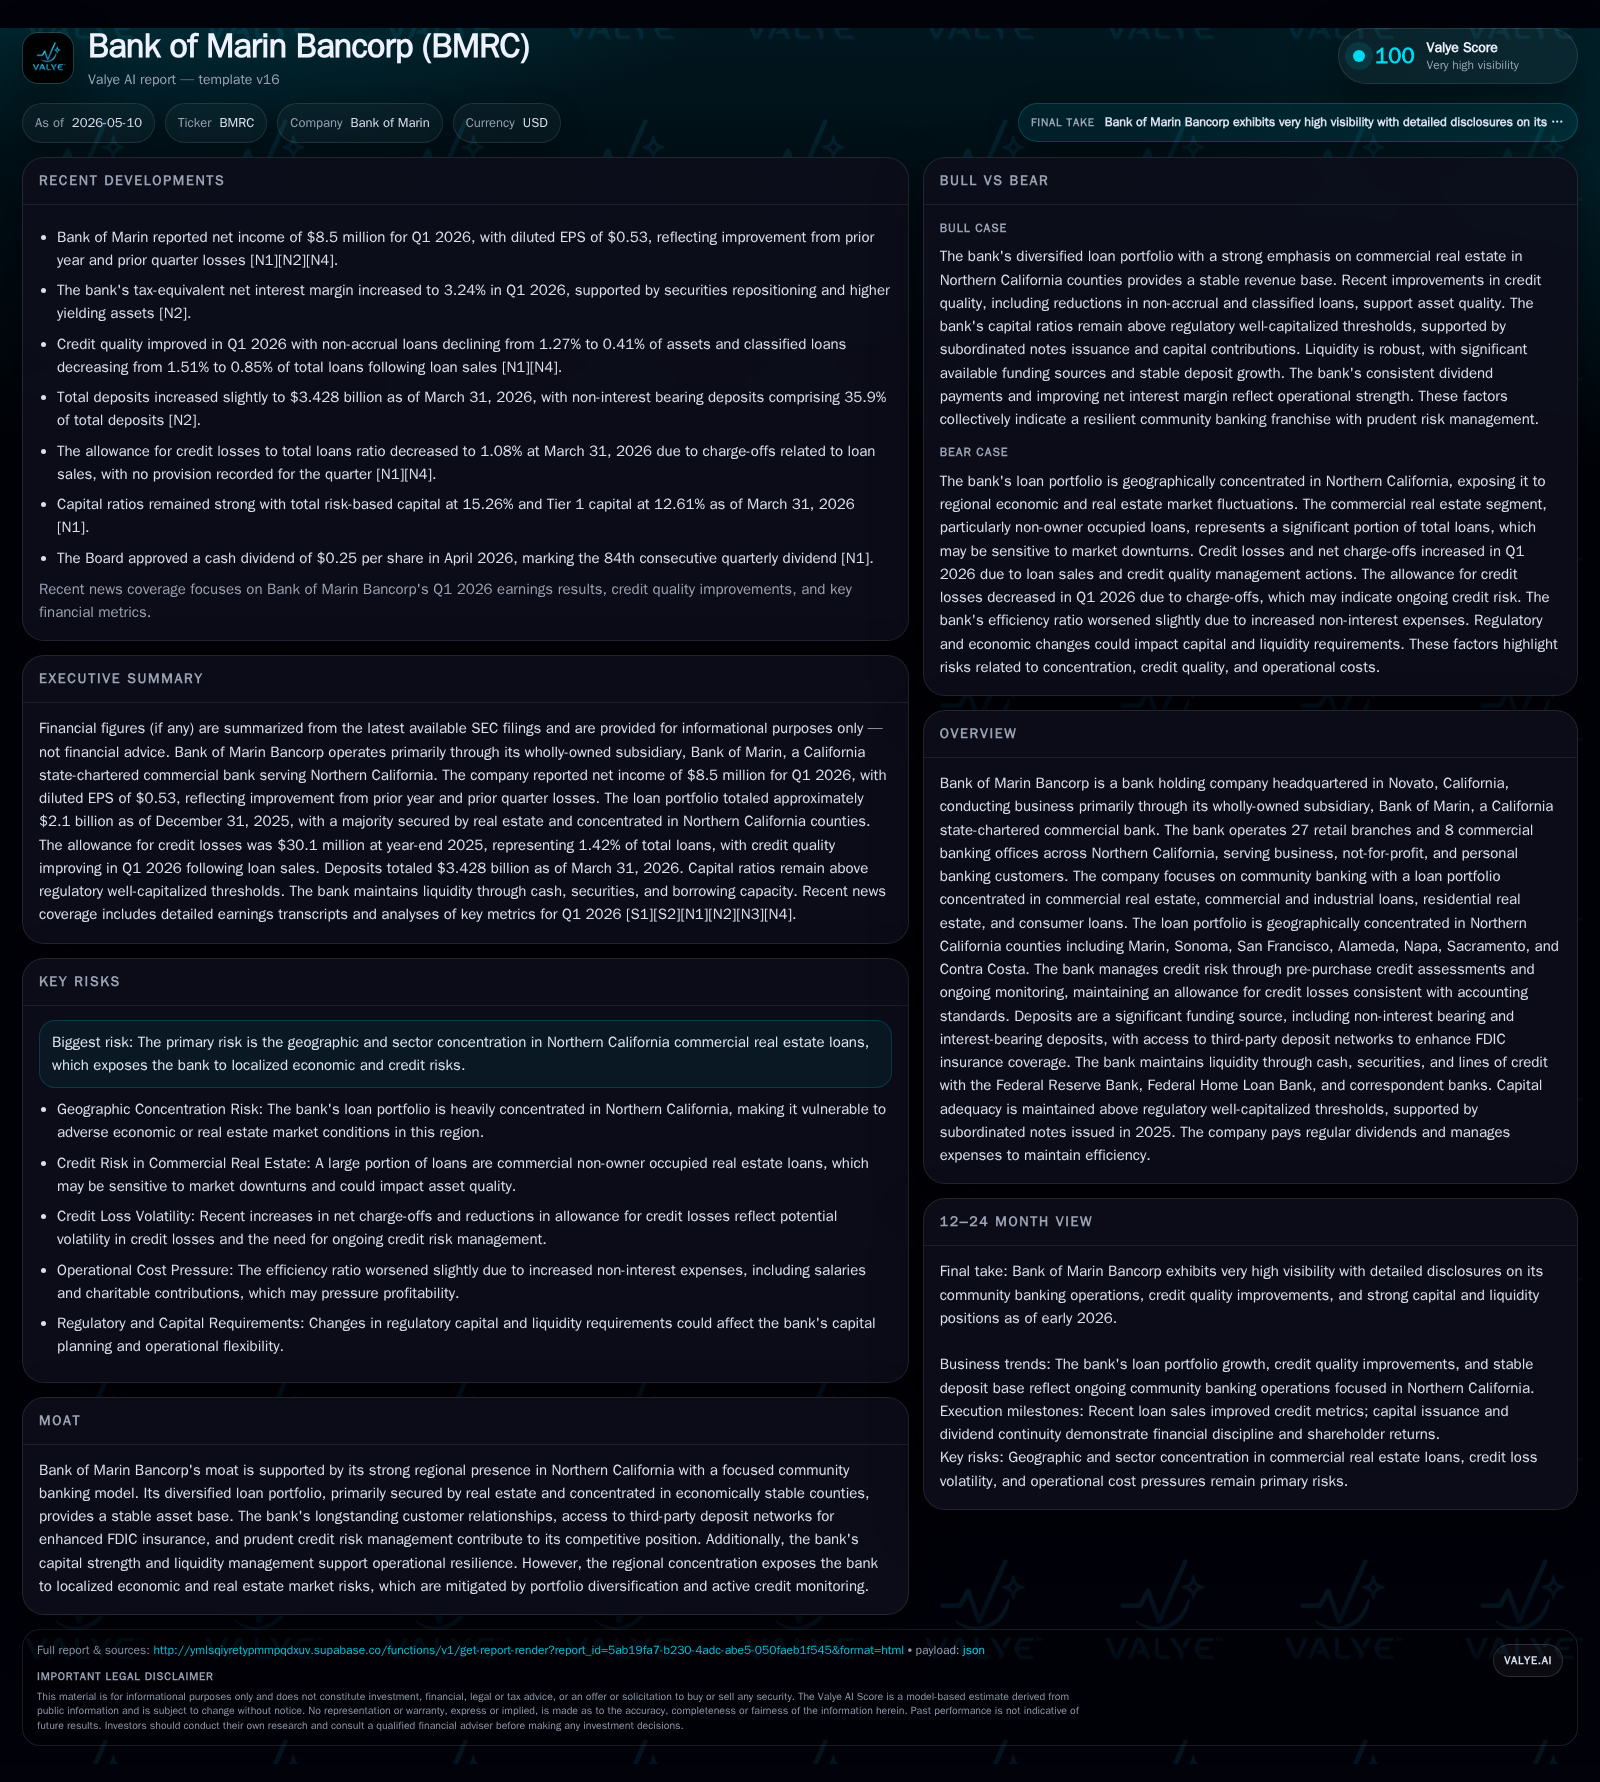
Bank of Marin Bancorp reported a notable turnaround in Q1 2026 with GAAP net income of $8.5 million, rebounding from a $39.5 million loss in Q4 2025. The tax-equivalent net interest margin improved to 3.24%, driven by strategic securities repositioning and loan yield enhancement. Bank of Marin continues to leverage its community banking model concentrated in Northern California’s relatively stable commercial real estate and diversified loan portfolio. While recent deposit cost reduction and asset repricing underpin margin gains, geographic and sector concentration remain key risk factors.
Q1 2026 Operating Highlights: From Loss to Profit
Bank of Marin Bancorp delivered a sharp financial rebound in the first quarter of 2026, posting GAAP net income of $8.5 million compared to a significant loss of $39.5 million in the preceding quarter [S2]. This swing reflects the absence in Q1 of the $69.5 million pretax loss on sales of securities incurred in Q4 2025 and underlying operational improvements. Diluted EPS rose to $0.53 from a loss per share of $(2.49) in the prior quarter [S2]. The pre-tax, pre-provision income also strengthened substantially, indicating momentum in core operations excluding loan-loss provisions.
Importantly, the tax-equivalent net interest margin (NIM) expanded to 3.24% from 3.18% sequentially [S10], underpinned by higher yielding assets following strategic repositioning of investment securities late in 2025 as well as improved loan yields amid rising rates. Deposit costs have begun to ease modestly with average interest-bearing deposit costs falling slightly but total deposit cost remains steady due to shifts in deposit mix.
Business Model and Community Banking Focus
Bank of Marin Bancorp operates primarily through Bank of Marin, a California state-chartered commercial bank focused on serving business, nonprofit, and personal banking customers across Northern California [S1]. Its footprint includes 27 retail branches and 8 commercial banking offices concentrated across select counties such as Marin, Sonoma, San Francisco, Alameda, Napa, Sacramento, and Contra Costa.
The bank’s core business model centers on community banking principles: cultivating long-term customer relationships combined with a diversified loan portfolio emphasizing commercial real estate (CRE), industrial/commercial loans, residential mortgages, and consumer loans [S1]. Around 90%+ of loans are secured by real estate collateral [S1], providing a relatively stable asset base supported by underwriting standards focusing on cash flow repayment capacity and conservative loan-to-value ratios.
Credit risk management is proactive: it includes pre-purchase credit assessment, ongoing monitoring, periodic allowance for credit losses aligned with regulatory standards, and risk rating categories that assess borrower strength comprehensively [S11]. This approach is critical given the portfolio’s regional concentration in Northern California.
Northern California Market Role and Competitive Positioning
Within its geographic footprint, Bank of Marin occupies a niche as a community bank leveraging deep local knowledge and regulatory familiarity. This specialization generates barriers to entry for larger national banks less focused on regional nuances or smaller banks lacking scale.
Its competitive advantages include strong customer loyalty through longstanding relationships facilitated by its branch network and community presence. Moreover, its access to reciprocal third-party deposit networks such as CDARS (Certificate of Deposit Account Registry Service), ICS (Insured Cash Sweep), and demand deposit marketplace solutions enhances liquidity by placing larger FDIC-insured deposits efficiently while managing balance sheet funding costs [S1].
Regionally stable economic fundamentals—supported by diversified industries and relatively resilient real estate markets—complement the bank’s position but also create dependency risk on local market conditions that must be actively managed.
Loan Portfolio Composition and Credit Risk Management
As of year-end 2025, total loans increased modestly to $2.12 billion with increments primarily in commercial non-owner occupied CRE loans ($1.37 billion or ~64.5%) while residential real estate loans contracted slightly [S1].
Other categories include commercial owner-occupied (14.6%), home equity (4.7%), other residential (5.2%), C&I (7.5%), construction (0.7%), and consumer installment/other (2.8%) loans [S1]. Approximately over 90% of loans are secured by real estate collateral fostering asset-backed resilience. Loan originations accelerated last year to $273.5 million versus $152.6 million previously but were moderated by payoffs totaling $145.7 million [S1].
Active credit oversight categorizes assets into Pass (acceptable quality), Special Mention (potential weaknesses), Substandard (payment capability issues), and Doubtful (likely partial losses) tiers [S26]. Time deposits remain approximately 6-7% but have been trending down modestly as part of liability mix management.
Significantly, the bank employs third-party networks like Promontory Interfinancial Network for CDARS and ICS products enabling high aggregate FDIC insurance above standard limits [S1]. Reciprocal deposits inflow provides on-balance-sheet stickiness whereas one-way deposits are off-balance-sheet though useful for liquidity allocation flexibility; both mechanisms optimize funding costs while preserving capital adequacy.
Maturities on uninsured time deposits weighted heavily within three months total about $103 million with expected high renewal rates mitigating liquidity risks [S1][S4]. Daily liquidity management uses multiple credit lines including $967 million secured FHLB borrowing capacity plus a $344 million FRB Discount Window line—unutilized at year-end—further underpinning operational agility.[S4][S21]
Growth Catalysts: Loan Origination, Margin Expansion, and Market Penetration
The recent uptick in NIM to 3.24% illustrates resumed pricing power amid rising market rates leveraged through higher-yielding loan production complemented by recent securities portfolio repositionings yielding positive margin contributions [S10][N1].
Loan growth opportunities hinge chiefly on reacceleration within the commercial real estate lending segment driven by sustained strength or recovery signals in Northern California real property markets alongside expanding demand from existing business clientele.[N1] Additionally, disciplined allowance policy supports confidence amidst cautious underwriting.
Cross-selling broader financial products through established branch presence aids retention while deposit cost advantages stemming from non-interest bearing dominance enable margin cushioning even if wholesale or brokered deposit alternatives are used sparingly given strategy preferences.
Key Risks: Geographic Concentration and Real Estate Exposure
Bank of Marin's primary risk lies in its concentrated exposure to Northern California’s real estate market—especially non-owner occupied commercial properties—which subjects it to localized cycles or regulatory changes affecting property values or cash flow stability [S19]. Adverse shifts could impair collateral values or increase delinquencies despite guarantor support structures.
Furthermore, maturities weighted around $198 million over the next twelve months for time deposits require successful renewals at similar terms or effective replacement funding strategies; failure here could pressurize liquidity or increase interest expenses unexpectedly.[S4]
Management's diversified lending book mitigates some sector-specific stresses but dependence on regional economies remains an inherent structural sensitivity.
Monitoring Milestones: Earnings Guidance, Credit Trends, and Deposit Behavior
Key forthcoming indicators include:
- Subsequent quarterly results verifying sustaining profit trends without large securities sale impacts.
- Credit quality evolution via non-performing asset levels or migration within risk classifications showcasing portfolio durability.
- Deposit renewal rates at upcoming uninsured time deposit maturities signaling funding stability or cost pressures.
- Updates on local Northern California economic trends influencing loan demand trajectory.[N2][N3][S2][S3]
Investor attention should focus on management commentary during earnings calls concerning balance sheet composition shifts or new strategic initiatives addressing geographic concentration risks.
Condensed Latest Financial Overview
Q1 2026 net income stood at $8.5 million GAAP after absorbing no significant security sales losses seen in prior quarters; adjusted net income excluding these losses was nearly flat sequentially demonstrating ongoing core profitability gains [S2]. Diluted EPS improved substantially to $0.53 reflecting operational recovery compared to $(2.49) previously.
Net interest margin benefitted from both asset yield enhancements (+21 bps impact from securities repositioning) and lower average cost on interest-bearing deposits albeit offset partially by retreating non-interest bearing balances leading total deposit cost to hold steady at ~1.35%. Total loans at amortized cost rose slightly consistent with earlier origination vs payoff swings.[S10]
Capitalization remains solid post subordinated note issuance ($45 million fixed-to-floating maturity 2035) enhancing Tier 2 capital while cash holdings plus borrowing lines provide robust liquidity buffers.[S6][S12][S24] Dividend policy was affirmed with a quarterly payout rate consistent at $0.25 per share reinforcing confidence in cash flow sufficiency.[S3]
Disclaimer: This analysis is based solely on publicly filed SEC documents and corroborating news reports as of May 2026 without projections or investment recommendations.
Disclaimer: This is research-only, informational analysis and not investment advice. It may include AI-generated interpretation and general industry context. Always verify important details using primary sources.
Comments