
Bank of Hawaii’s Earnings Upswing and Market Edge in Pacific Banking
Strong Q4 2025 results and a robust capital strategy underscore Bank of Hawaii's local dominance amid leadership change.
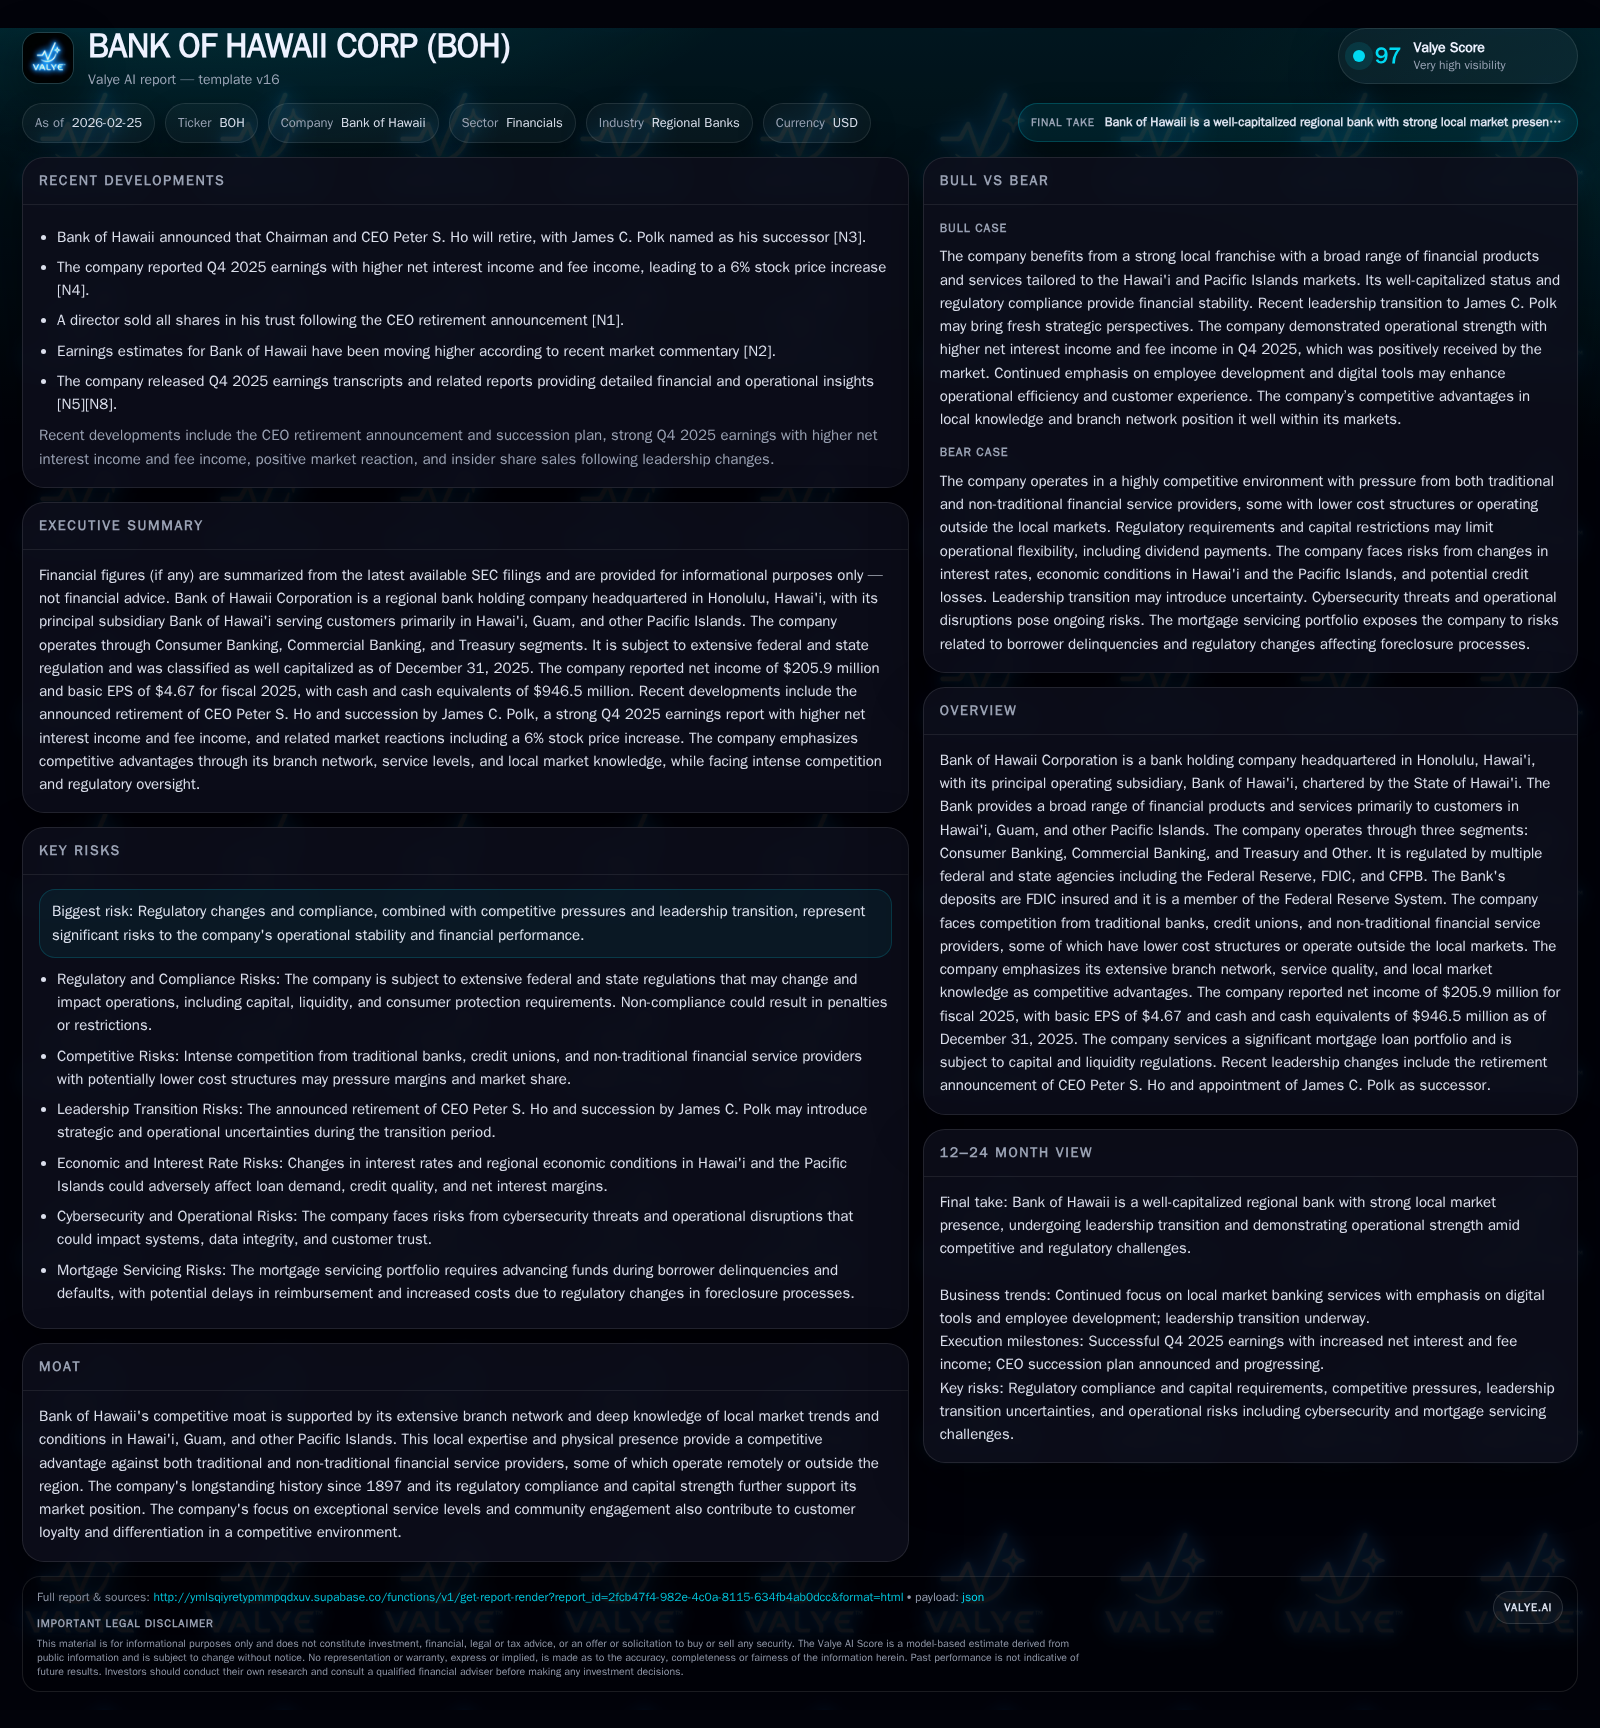
Bank of Hawaii Corporation showcased a notable earnings surge in 2025, buoyed by its deep roots in Hawaiian and Pacific Island markets and prudent capital allocation. The bank’s concentrated loan portfolio and extensive branch network underpin its competitive moat, even as it faces evolving regulatory scrutiny and leadership transition. Future growth hinges on leveraging commercial and consumer lending opportunities while navigating regional economic sensitivities tied to tourism and real estate sectors.
Resilient Historical Growth Driven by Local Market Expertise
Bank of Hawaii (BOH) has delivered a notable rebound in profitability in the most recent fiscal year, underscoring the strength of its long-established franchise that dates back to 1897. Net income surged 37.3% year-over-year to $205.9 million in 2025 from $149.9 million in 2024 [F1]. This represents a significant upswing following fluctuations over prior years ($171.2 million in 2023 and $225.8 million in 2022). The resurgence aligns with improved net interest income fueled by favorable interest rate conditions as well as expanded fee-based activities.
The bank’s enduring connection to Hawaiian and Pacific Island markets has been instrumental to this sustained growth trajectory, allowing it to capitalize on local economic nuances such as tourism cycles, military spending, and real estate dynamics that broadly influence credit demand.
Historical performance (annual)
| FY | Net ($mm) | CFO ($mm) | Capex ($mm) | Net YoY |
|---|---|---|---|---|
| 2025 | 206 | 218 | 34 | +37.3% |
| 2024 | 150 | 178 | 10 | -12.4% |
| 2023 | 171 | 150 | 9 | -24.2% |
| 2022 | 226 | 333 | 29 |
Note: Omitted columns lack sufficient annual XBRL coverage in the provided tags (need ≥2 annual points): Rev, OpInc. Source: SEC companyfacts cache [F1].
Capital returns and efficiency (annual)
| FY | Div ($mm) | Buybacks ($mm) | FCF ($mm) |
|---|---|---|---|
| 2025 | 113 | 5 | 184 |
| 2024 | 112 | 5 | 169 |
| 2023 | 112 | 14 | 141 |
| 2022 | 113 | 55 | 304 |
Source: SEC companyfacts cache [F1].
Note: Revenue not available; Operating income omitted due to insufficient data.
Diverse Loan Portfolio Concentrated in Hawaii and Pacific Islands
BOH’s lending portfolio underscores its strategic focus on Hawai’i and the broader Pacific territories, which together account for roughly 97% of total loans as of December 31, 2025 [S1][S4]. The portfolio is heavily weighted toward real estate-secured financing: approximately $4.2 billion in commercial mortgages (29.9%) and $4.8 billion in residential mortgages (33.9%) compose the largest segments.
Commercial loans include commercial mortgage, commercial & industrial (C&I), construction loans, and lease financing totaling $6.09 billion, predominantly fixed-rate [S4]. Consumer loans encompass home equity lines ($2.1 billion), automobile loans ($690 million), residential mortgages (~$4.8 billion), and other consumer credits (totaling nearly $8 billion). Geographic diversification beyond Hawai’i exists but is limited—Guam, other Pacific Islands, and the U.S mainland represent minor portions.
Maturity profiles reveal sizeable loan tranches with staggered amortization schedules extending beyond ten years for real estate-related credits while variable-rate loans represent around $2.4 billion within fixed-rate periods [S4]. This mix reflects a balance between interest rate risk management and customer demand preferences.
Q4 2025 Earnings Beat: Drivers Behind Revenue and Net Interest Income Growth
The bank’s Q4 performance outpaced consensus expectations on both earnings per share (EPS) and revenue metrics [N2][N6][N7][N11]. Management attributed the uplift primarily to net interest income expanding amid a rising yield curve environment that allowed BOH to widen lending spreads without an immediate offsetting increase in funding costs [N2]. Fee income also grew sustainably across diversified streams including wealth management fees, transaction services, and loan-related fees — reflecting successful cross-selling efforts within the bank’s extensive customer base.
Operational cost controls further supported margin expansion; efficiency gains emerged despite investments into digital enhancements aimed at modernizing customer touchpoints without sacrificing personalized service in its branch network noted as a key differentiator [N6]. Transcript commentary highlighted ongoing focus areas like optimizing deposit mix and cautiously managing credit provisioning given prevailing economic uncertainties [N3].
Leadership Transition: Strategic Implications for Bank Direction
A material corporate event occurred with the retirement announcement of Peter S. Ho as chairman and CEO after a lengthy tenure [N9]. His successor, James C. Polk, was appointed CEO effective early 2026 bringing internal continuity but also ushering operational risk inherent in leadership change during a competitive phase for the company.
While governance mechanisms aim to mitigate disruption risks—such as oversight by an experienced board—the market took note of insider director share sales coinciding with this transition as potential signaling [N8]. The company has cited this leadership shift among operational risks warranting attention due to potential impacts on strategic priorities during crucial growth execution phases .
Growth Outlook: Opportunities in Commercial and Consumer Segments
Outlook commentary anchored on opportunities arising from commercial mortgage demand linked to ongoing real estate transactions within Hawai’i’s recovering property market as well as moderate consumer borrowing upticks spurred by local economic activity [N1][S1][S4]. Rebounding tourism appears pivotal since it affects employment levels that underpin residential mortgage repayment capacity.
Market analysts including Keefe Bruyette & Woods have revised forecasts upward based on stronger-than-expected fundamental traction evidenced by modest loan growth acceleration coupled with stable credit metrics [N10]. However, heightened sensitivity remains toward external shocks such as fluctuating visitor volumes or housing price shifts given over-60% concentration of loans collateralized by real estate.
Competitive Landscape: Local Branch Network vs Non-Traditional Players
BOH’s moat flows significantly from its entrenched branch network spread across Hawai’i plus Guam and surrounding islands—offering customers frictionless access combining digital convenience with personalized relationship banking difficult for purely digital or fintech competitors replicating such proximity-based trust [S5].
Nevertheless, challenges intensify from nimble fintech entrants leveraging low-cost structures without heavy physical infrastructure plus credit unions exerting pricing pressures locally [S5]. BOH counters these by emphasizing service quality rooted in cultural understanding ('ohana values), flexible product bundles aligned with community needs, particularly in commercial lending domains where bespoke service wins incremental business.
Capital Allocation Framework: ROE, Dividends, and Share Buybacks Trends
Return on equity hovers near a healthy ~11% calculated from last year’s net income against equity base at approximately $1.85 billion at close of FY25 [F1]. Strong net cash from operations reached $218 million while capital expenditures spiked notably (+252%) owing to modernization projects [F1]. Free cash flow approximates $184 million after capex outlays.
Dividends paid remain consistent around $113 million annually supporting reliable shareholder returns; however share repurchases dropped sharply from over $55 million in FY22 down to just $5 million in FY25 indicating conservatism or reprioritization of capital uses under current macro constraints [F1][S7]. Regulatory dividend constraints also remain critical considerations given layered federal/state rules impacting flow-through from Bank subsidiary to parent entity.
Credit Quality and Risk Management Amid Regional Economic Sensitivities
Loan portfolio quality is closely monitored considering pronounced regional dependencies on tourism-driven consumption patterns plus real estate sector fluctuations that shape borrower capacity [S6][S14]. Roughly two-thirds of outstanding loans are secured by residential or commercial properties concentrated regionally enhancing vulnerability to localized downturns.
Notably, crosswaves such as inflation pressure affecting consumer spending power or temporary dips in occupancy rates directly impact borrowers’ repayment profiles prompting vigilant risk provisioning protocols backed by historical data on delinquencies matching economic cycles [S1][S14]. Regulatory compliance intensifies cost structures especially relating to increased CFPB oversight despite recent deregulatory shifts creating an evolving compliance landscape requiring adaptive controls.
What to Watch: Upcoming Milestones and Market Signals
Investor focus should pivot toward quarterly loan origination volumes signaling demand health especially from commercial mortgage pipelines; early Q1 reports will provide clarity on momentum post-leadership handoff [N3][N4]. Asset quality updates are critical given macro uncertainties including natural disaster exposure inherent to island locations.
Interest rate environment developments will dictate net interest income progression amid competitive deposit pricing trends vulnerable to nationwide liquidity conditions [N10]. Additionally, any capital allocation strategy changes—especially dividend policies or buyback resumption—will be telling about confidence levels internally amidst an evolving regulatory framework limiting flexibility [N10][S7].
In sum, Bank of Hawaii’s blend of deep-rooted local understanding combined with measured innovation supports its uptrend trajectory but requires continuous vigilance given concentration risks coupled with competitive threats from fintechs poised for market disruption.
This analysis is based solely on publicly available information including recent SEC filings ([S#]), news releases ([N#]), XBRL financial data ([F1]) and company disclosures as of late February 2026 without projecting future securities performance or investment recommendations.
Disclaimer: This is research-only, informational analysis and not investment advice. It may include AI-generated interpretation and general industry context. Always verify important details using primary sources.

Comments