
Bank of Hawaii: Local Market Depth, Capital Management, and the Pressures of Regional Banking in Transition
Bank of Hawaii’s Q3 2026 results highlight its continued local market strength and capital return efforts, but recent underperformance versus expectations and mixed revenue trends point to the persistent challenges facing regional banks amid shifting competitive and regulatory landscapes.
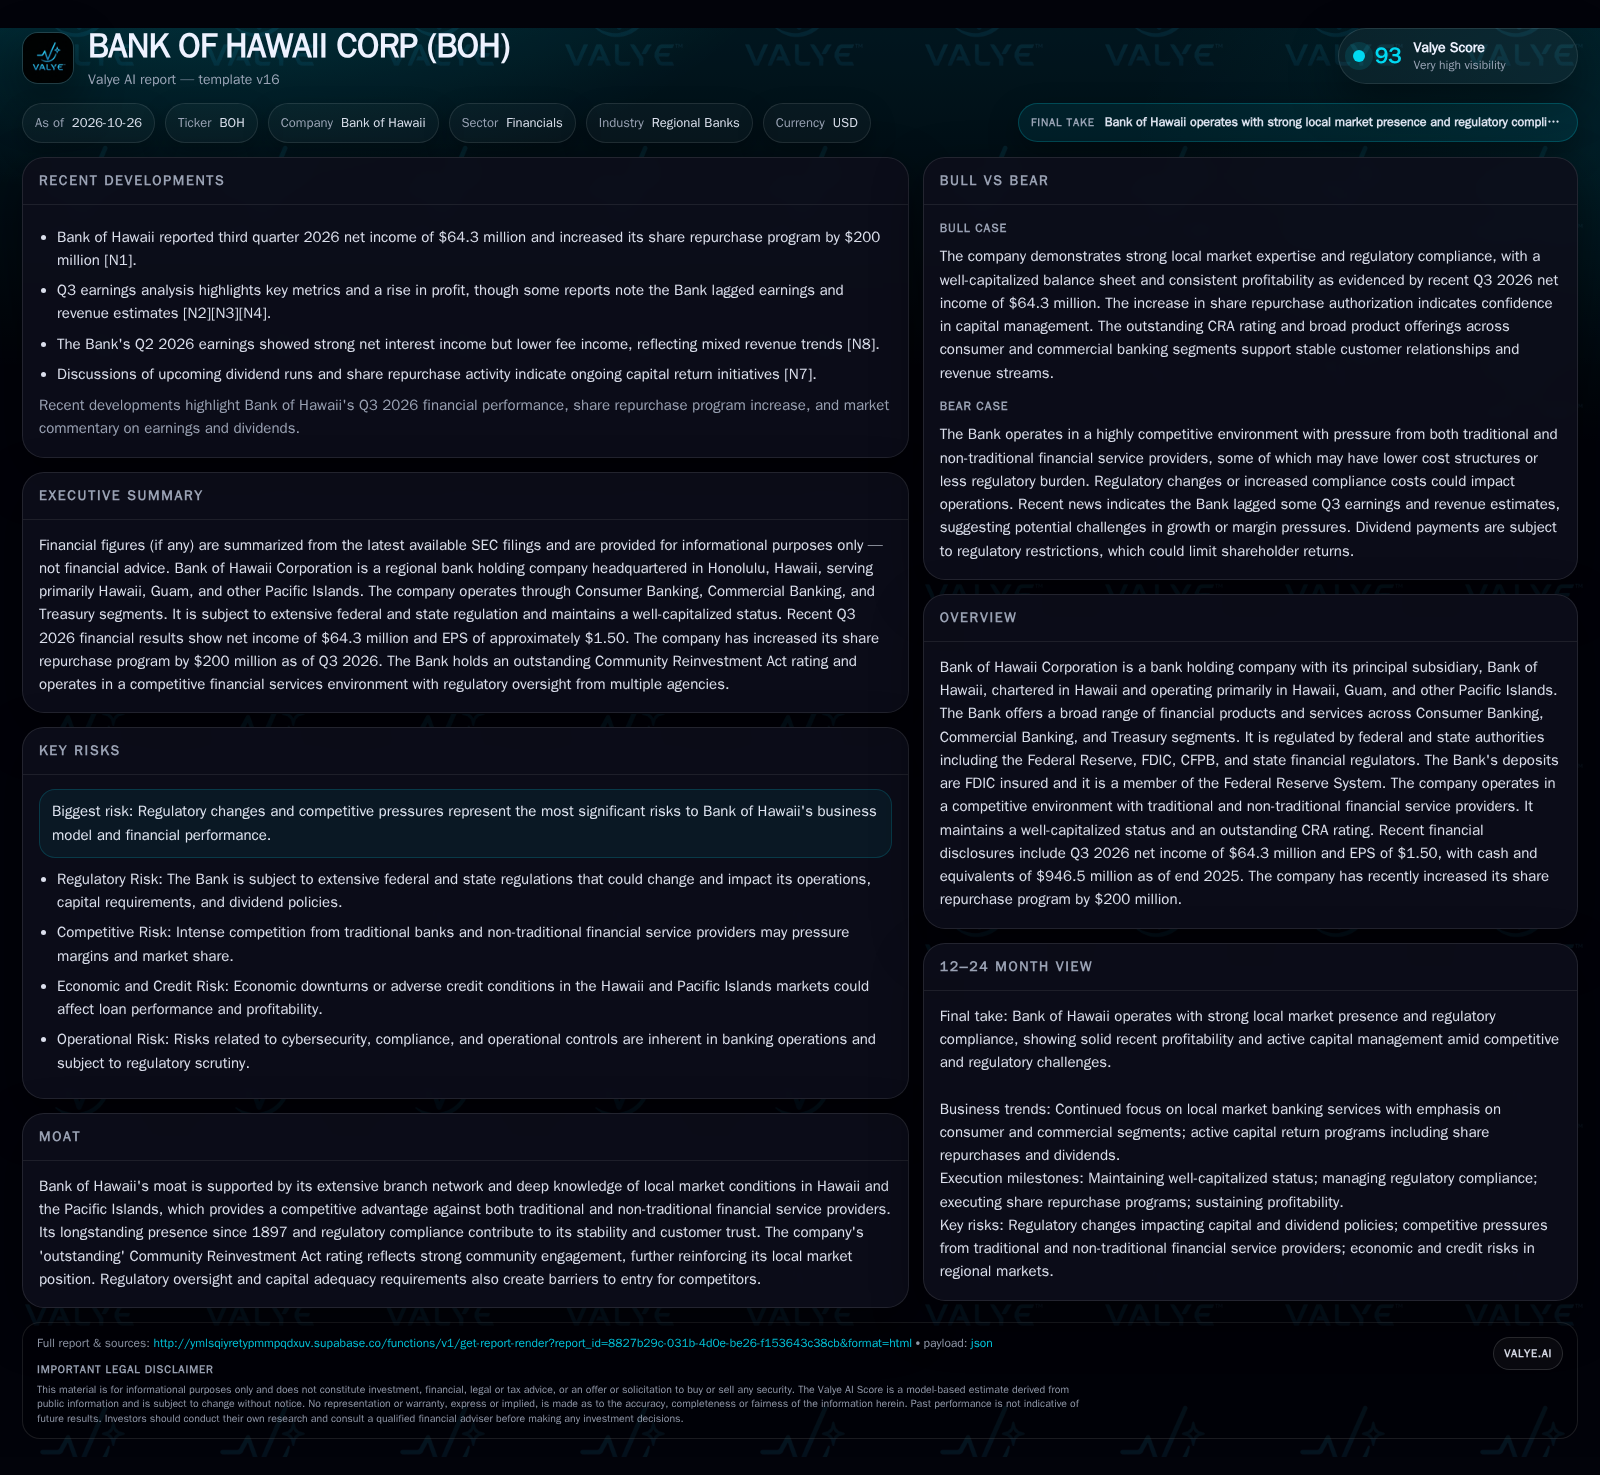
Bank of Hawaii reported Q3 2026 net income of $64.3 million and expanded its share repurchase authorization by $200 million, underscoring disciplined capital management. Despite a strong local presence and regulatory standing, the bank faced mixed results—beating on profit but lagging on revenue estimates and fee income—reflecting margin pressures and competition from both traditional and non-traditional lenders. The company’s well-capitalized status and outstanding CRA rating remain strengths, but sustaining profitability will likely depend on navigating evolving market dynamics, regulatory risks, and the balance between net interest and fee-based income streams. [S2] [N1] [N2] [N3] [N4] [N8]
Bank of Hawaii’s latest earnings underscore the defining strengths and vulnerabilities of a mature regional bank deeply embedded in its local markets. The company delivered Q3 2026 net income of $64.3 million and increased its share repurchase program by $200 million, reinforcing its commitment to shareholder returns and capital discipline. Yet, the bank’s results fell short of some revenue and earnings expectations, and fee income trends remain weak. This outcome reflects both the enduring appeal of Bank of Hawaii’s local franchise and the mounting pressures from intense competition, evolving regulation, and a changing revenue mix. The question for investors is whether the bank’s local depth and capital management can offset the structural headwinds facing regional lenders.
Recent Results: Profitability and Capital Actions Amid Mixed Top-Line Trends
In Q3 2026, Bank of Hawaii reported net income of $64.3 million and basic EPS of $1.50, a result that marked a year-over-year increase in profit but did not fully meet analyst expectations for revenue and earnings [S2] [N2] [N3] [N4]. The board expanded the share repurchase program by $200 million, signaling ongoing commitment to capital return and confidence in the bank’s capital position [N1]. While net interest income remained robust in the prior quarter, fee income continued to soften, contributing to a mixed revenue profile [N8]. The bank’s strong regulatory standing—well-capitalized status and an outstanding CRA rating—remains a clear asset [S1]. These facts collectively frame a company that is profitable and disciplined, but navigating persistent challenges in revenue growth and margin sustainability.
How Bank of Hawaii’s Revenue Mix and Cost Structure Shape Its Earnings Power
Bank of Hawaii generates revenue primarily from net interest income—driven by the spread between interest earned on loans and investments and interest paid on deposits—and secondarily from fee-based services such as deposit account fees, wealth management, and transaction charges. The reliance on net interest income makes the bank’s earnings sensitive to interest rate cycles, loan demand, and deposit pricing competition. Fee income, while a crucial diversifier, has softened in recent quarters, potentially due to lower transaction volumes, regulatory caps on certain fees, or competitive pricing [N8].
Operating leverage in regional banking is typically moderate: fixed costs for branches, compliance, and technology are high, but incremental deposit or loan volume can drive profitability if asset quality is preserved. The bank’s capital return via share repurchases suggests management sees limited organic growth opportunities relative to excess capital, or a desire to offset dilution. Capital needs are shaped by regulatory requirements, credit risk, and the need to maintain a buffer for loan losses. The balance between cost control, digital investment, and community presence will likely determine future operating efficiency and return on equity.
Local Franchise Strength Versus Evolving Competitive Threats
Bank of Hawaii’s competitive edge rests on its deep-rooted presence and brand recognition in Hawaii and the Pacific Islands, supported by a dense branch network and longstanding customer relationships [S1]. This local knowledge and service orientation create switching frictions for legacy customers and support stable deposit bases. The bank’s ‘outstanding’ CRA rating and community engagement further reinforce its reputation and regulatory goodwill.
However, the competitive landscape is intensifying. Traditional rivals include other regional and national banks, as well as credit unions and mortgage companies. Increasingly, non-traditional financial service providers—such as fintechs and digital-first lenders—are targeting specific niches with lower overhead and technology-driven experiences [S1]. These entrants can pressure both fees and deposit pricing, especially among digital-native consumers. The bank’s ability to innovate, manage costs, and defend its core customer base will be tested as technology and consumer expectations evolve.
Unlocking Earnings Growth Through Digital Expansion and Fee Income Recovery
A favorable scenario for Bank of Hawaii would involve stabilization or expansion of net interest margins, successful investment in digital banking capabilities, and a rebound in fee-based revenue. If the bank can leverage its local brand to cross-sell higher-margin products, deepen digital engagement, and attract younger or more affluent customers, it could offset traditional margin pressures. Regulatory stability and benign credit conditions would further support earnings.
Evidence that would confirm this trajectory includes sequential improvement in fee income, growth in digital channel adoption, stable or rising net interest margin, and positive operating leverage (i.e., revenue growth exceeding expense growth). New product launches or partnerships with fintechs could also signal strategic adaptation. Conversely, continued fee income weakness or digital lag would challenge this outcome.
Navigating Slow Growth: Resilient Core, Ongoing Margin Compression
The most plausible outlook is one in which Bank of Hawaii maintains profitability and capital discipline but contends with slow loan growth, modest net interest margin compression, and persistent fee income softness. The bank’s entrenched local position supports stable deposits and moderate loan demand, but competitive and regulatory pressures limit pricing power and noninterest revenue growth.
Confirmation of this scenario would come from continued positive but unremarkable earnings, high capital ratios, and steady (but not growing) market share. If disclosed, loan growth and deposit retention metrics would likely show incremental gains rather than breakout performance. Any acceleration in expense growth or a further decline in fee income would tilt the balance toward downside risk.
Margin Squeeze and Fee Erosion Amplify Regional Bank Vulnerabilities
The adverse case for Bank of Hawaii centers on a confluence of margin compression, credit deterioration, and accelerated fee income decline. A sustained low or inverted yield curve could pressure net interest margins, while digital competitors erode fee income and customer loyalty. Regional economic weakness—such as a downturn in Hawaii’s tourism or real estate sectors—could trigger higher credit losses.
This scenario would be confirmed by declining net interest margin, rising nonperforming loans, sequential drops in fee revenue, and any need to curtail dividends or repurchases to conserve capital. Regulatory interventions or the need to raise external capital would further underscore downside risks.
Milestones and Metrics That Will Shape Bank of Hawaii’s Competitive and Financial Trajectory
Quarterly trends in net interest margin: Sustained compression would signal ongoing profitability pressures.
Fee income performance: Sequential improvement or continued declines will reveal the success of revenue diversification efforts.
Loan growth and credit quality (if disclosed): Changes in loan balances and nonperforming assets would illuminate demand and risk dynamics.
Deposit growth and mix: Stability or erosion in core deposits, especially among retail and small business customers, will test franchise strength.
Expense trends and operating leverage: A useful metric would be the relationship between expense growth and revenue growth, indicating cost discipline.
Digital adoption rates (if disclosed): Growth in digital banking usage or new digital product uptake would help assess competitive adaptation.
Regulatory or legislative developments: Any changes affecting capital, compliance, or product offerings could materially impact the business model.
Disclaimer: This is research-only, informational analysis and not investment advice. It may include AI-generated interpretation and general industry context. Always verify important details using primary sources.

Comments