
Bridgewater Bancshares Strengthens Regional Footprint Amid Margin Pressure
Loan growth and deposit strength in the Twin Cities support Bridgewater Bancshares’ core net interest income, while margin compression and credit costs pose challenges.
Bridgewater Bancshares reported a steady increase in its loan portfolio to $64.1 million at June 30, 2026, underpinning net interest income despite ongoing net interest margin pressure amidst a shifting rate environment. The company’s retail and commercial banking operations remain deeply rooted in the Twin Cities metropolitan area, supported by local deposit inflows and an expanding branch network. Competitive dynamics with larger regional peers and fintech entrants limit fee diversification and pricing power. Credit quality has remained stable but warrants close observation given elevated economic uncertainties. Recent branch expansion and equity distribution agreements highlight growth ambitions amid tightening profitability dynamics.
Q2 Earnings Highlight Loan Growth during Margin Compression
Bridgewater Bancshares Inc reported solid loan portfolio growth in the quarter ended June 30, 2026, with loans including fees increasing to $64.1 million [S2]. This growth underpins rising net interest income—a primary revenue driver for regional banks that rely on the spread between interest earned on loans and paid on deposits. However, Bridgewater faced net interest margin (NIM) pressure during the quarter, consistent with broader industry challenges during fluctuating interest rates. Despite the margin compression, the company delivered earnings per share (EPS) of $0.47 (basic) and $0.45 (diluted) [F1], reflecting resilience against competitive and market pressures.
The rise in loan balances suggests robust demand for credit within Bridgewater’s primary market, the Twin Cities metropolitan statistical area (MSA), aligning with cyclical local economic activity and business investment trends [S2]. Yet, compressed NIM indicates that rising funding costs or increased competition are limiting spread expansion—a critical factor since NIM directly influences net interest income (NII) and thus profitability in traditional banking models.
Bridgewater’s Core Banking Model Anchored in Twin Cities Relationships
Bridgewater operates as a financial holding company owning Bridgewater Bank, which provides retail and commercial loans alongside deposit services principally within the Twin Cities MSA [S1][S2]. The bank's revenue model centers on generating net interest income from its loan portfolio while maintaining a robust retail deposit base, which offers lower-cost funding compared to wholesale markets.
The company’s customer relationships appear concentrated locally, leveraging community ties through a growing branch network that includes recent expansion into Lake Elmo [S5]. Such physical presence fosters deeper penetration among retail consumers and small-to-medium enterprises (SMEs), facilitating cross-selling opportunities for ancillary fee-based products such as transaction accounts or investment services albeit not reported as significant revenue segments currently.
Fee income diversification remains limited relative to larger regional peers, which constrains Bridgewater’s ability to offset margin pressures solely through non-interest sources [S1]. The steady growth in loans supplemented by deposit inflows confirms effective balance sheet deployment but underscores dependence on traditional interest spread mechanics common among community banks.
Competitive Dynamics: Middle-Tier Regional Bank Versus Peers and Emerging Fintech
Within its competitive landscape, Bridgewater occupies a middle-tier position compared to larger regional institutions such as Regions Financial Corporation or Fifth Third Bancorp—both offering wider geographic reach, broader product suites, and stronger fee income diversification. These scale advantages translate into better pricing power and operational efficiency.
Bridgewater faces challenges competing against these players particularly in attracting higher-value commercial clients or leveraging advanced digital banking platforms. Emerging fintech lenders also present disruption risk by offering streamlined lending processes or flexible credit products appealing to younger or underserved customer segments, potentially eroding traditional loan origination volumes or pressuring pricing margins.
As fintech ecosystems continue maturing, Bridgewater's reliance on physical branches may limit rapid scalability but also deepens trust-based relationships critical in regional banking. Efficient cost management and selective technology investments will be key differentiators when balancing scale disadvantages.
Credit Quality and Asset Risk: Non-Performing Loans Picture
Credit risk remains central to Bridgewater’s operating outlook with management closely monitoring non-performing loans (NPLs) and provisioning levels [S2]. While detailed metrics are limited in recent filings, provisions for loan losses reflect prudent risk recognition amid uncertain macroeconomic conditions including inflationary pressures and potential localized slowdowns.
Maintaining asset quality is essential for preserving capital adequacy ratios and earnings stability given tighter regulatory scrutiny typical for regional banks. Any sustained uptick in NPL ratios would necessitate higher provisions impacting net income adversely. Thus, upcoming reports should be watched for signs of loan performance deterioration or recovery trends indicating underlying borrower health shifts.
Growth Levers: Branch Expansion and Local Economic Tailwinds
Bridgewater’s recent opening of a new branch location in Lake Elmo enhances its footprint on the eastern side of the Twin Cities market [S5]. This strategic move aims to capture incremental deposits and new lending relationships from underserved suburban areas experiencing residential development and commercial growth.
The company benefits from local economic tailwinds such as strengthening real estate markets—particularly commercial real estate construction—and increasing business formation that typically stimulate demand for loans alongside deposit accumulation. These dynamics underpin the company's loan growth trajectory visible in Q2 results.
Moreover, through community-focused branch expansion coupled with digital channel enhancements (though less disclosed), Bridgewater is positioning itself to capitalize on evolving consumer preferences without sacrificing personalized service that forms the core of its competitive advantage.
Risks to Monitor: Margin Pressures and Regulatory Compliance Costs
Several operational risks could constrain Bridgewater’s profit trajectory going forward. Chief among these is margin compression driven by rising funding costs amidst volatile Federal Reserve policy decisions impacting short- and long-term rates [S1][S2]. Given heavy reliance on net interest income, any sustained narrowing of spreads can materially suppress earnings.
Regulatory compliance costs also weigh on smaller institutions disproportionately compared to larger peers able to spread fixed compliance expenses over bigger revenue bases. Evolving rules around capital adequacy, consumer protection, anti-money laundering enforcement, or cybersecurity require ongoing investments that pressure the efficiency ratio—a critical metric for banking profitability.
Additionally, competitive intensity from fintech lenders continues to erode traditional revenue pools by enabling alternative lending channels that may capture younger demographics more efficiently.
Upcoming Catalysts: Loan Demand Signals and Interest Rate Trajectory
Monitoring upcoming indicators remains vital to assess Bridgewater’s momentum. These include local economic data affecting loan demand—the pace of commercial real estate projects, business credit appetite—and how yields evolve across the yield curve influencing margin management [S3][N1]
Management’s execution will also be evaluated by its ability to contain credit loss provisioning while driving balanced loan-to-deposit ratios supportive of liquidity without excessive leverage risk exposure. Absence of explicit guidance makes these factors particularly important as forward-looking markers for investors assessing earnings sustainability.
Financial Profile Discussion: Balance Sheet Strength Supports Strategic Flexibility
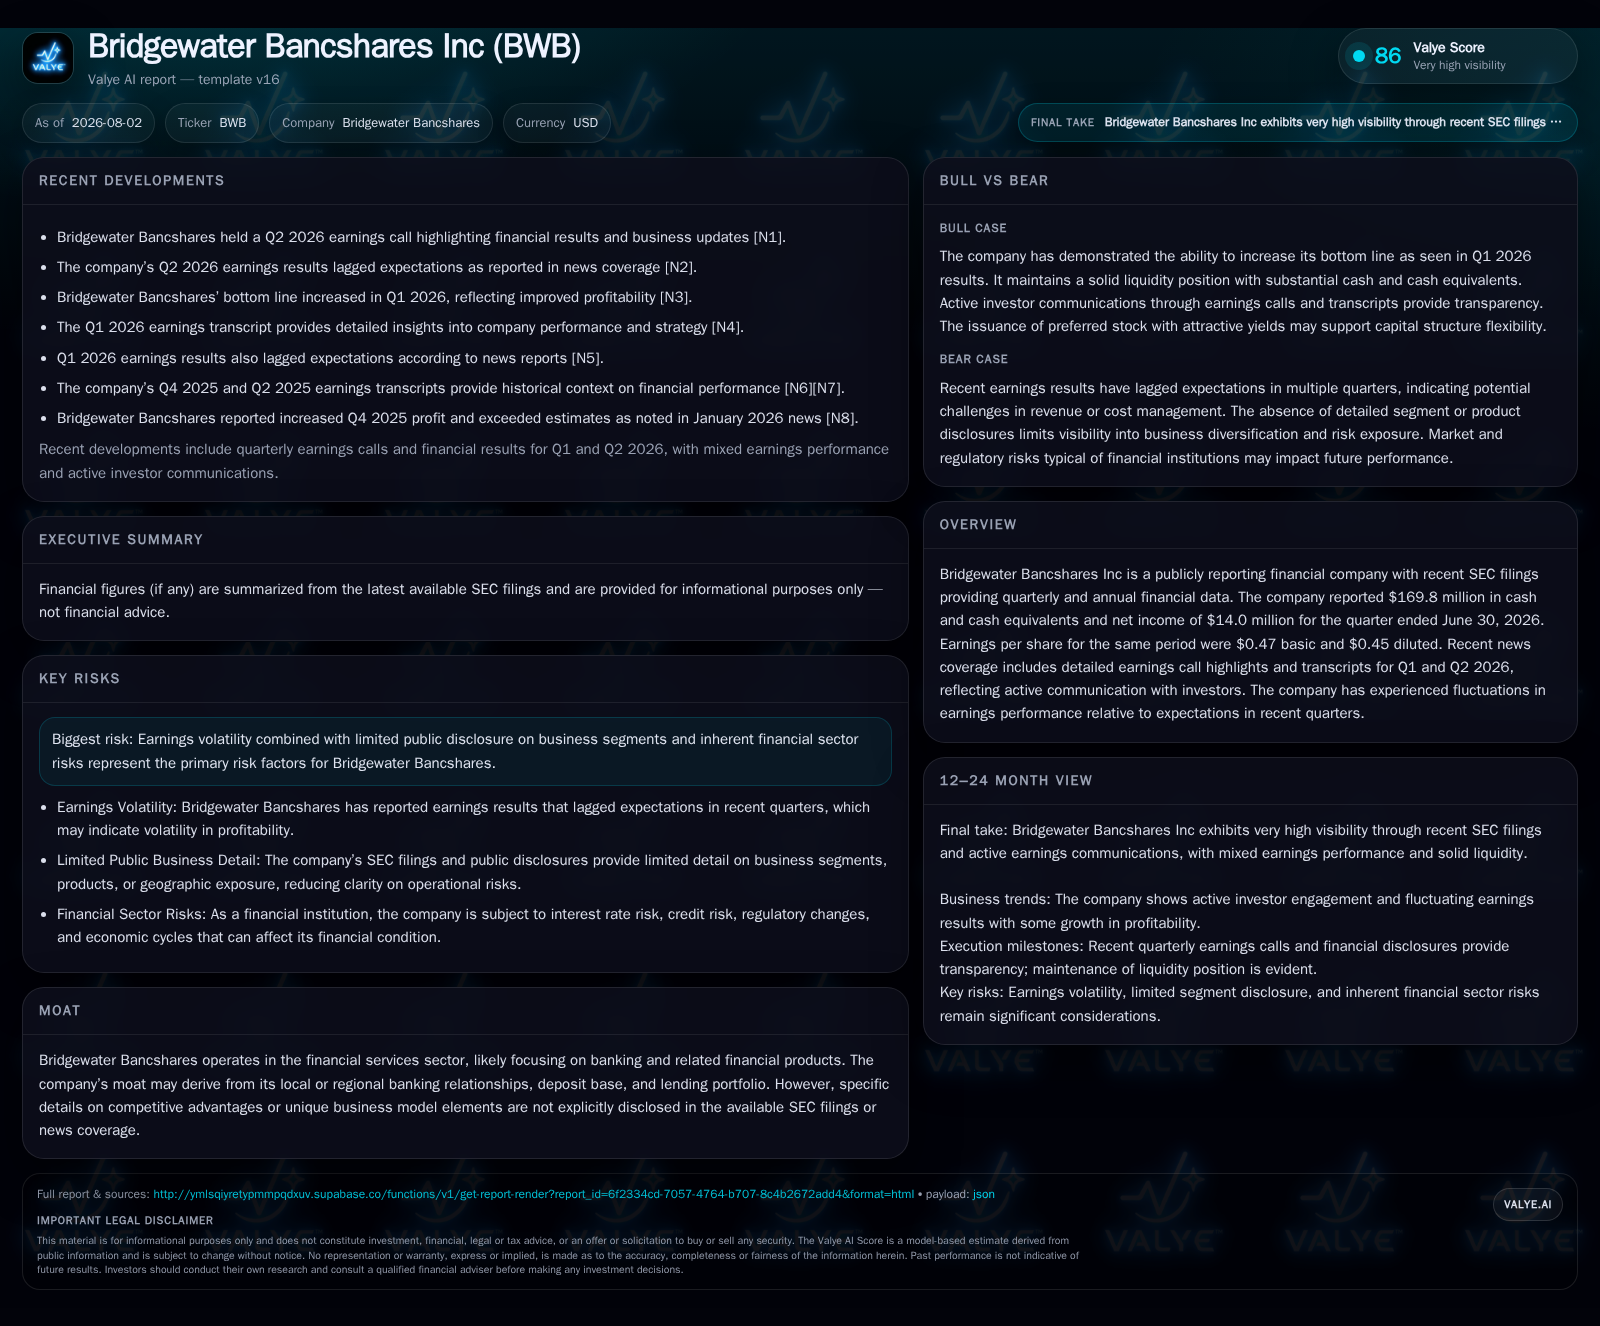
As of June 30, 2026, Bridgewater held $169.8 million in cash and cash equivalents providing liquidity headroom for ongoing operations or opportunistic investments [F1]. Net income development showing $14 million generated in Q2 further bolstered retained earnings during the first half year to approximately $31.4 million [S2], enhancing capital adequacy buffers necessary for regulatory compliance.
Though detailed leverage ratios are not fully disclosed yet, this capitalization level combined with an equity distribution agreement allowing up to $50 million additional common stock issuance affords considerable strategic flexibility [S5][S19]. Capital availability positions Bridgewater well to fund branch rollouts or absorb incremental regulatory cost impacts without immediate funding stress.
In summary, Bridgewater Bancshares demonstrates disciplined regional banking execution balancing modest loan portfolio growth against compressive net interest margins within a competitive Twin Cities environment. Its focus on local customer relationships supported by branch expansion strategy underpins a stable business model though profitability faces pressure from external market factors like rate volatility and fintech competition. Close attention to credit quality trends along with efficient cost control will define its near-term financial trajectory.
Disclaimer: This is research-only, informational analysis and not investment advice. It may include AI-generated interpretation and general industry context. Always verify important details using primary sources.

Comments