
Baldwin Insurance Group Expands Partnerships and Revenue but Faces Profitability Pressure and Cash Flow Deficits
Baldwin Insurance Group grew revenue by 8.3% in 2025 through partnerships and organic growth but continues to report net losses and negative operating cash flow.
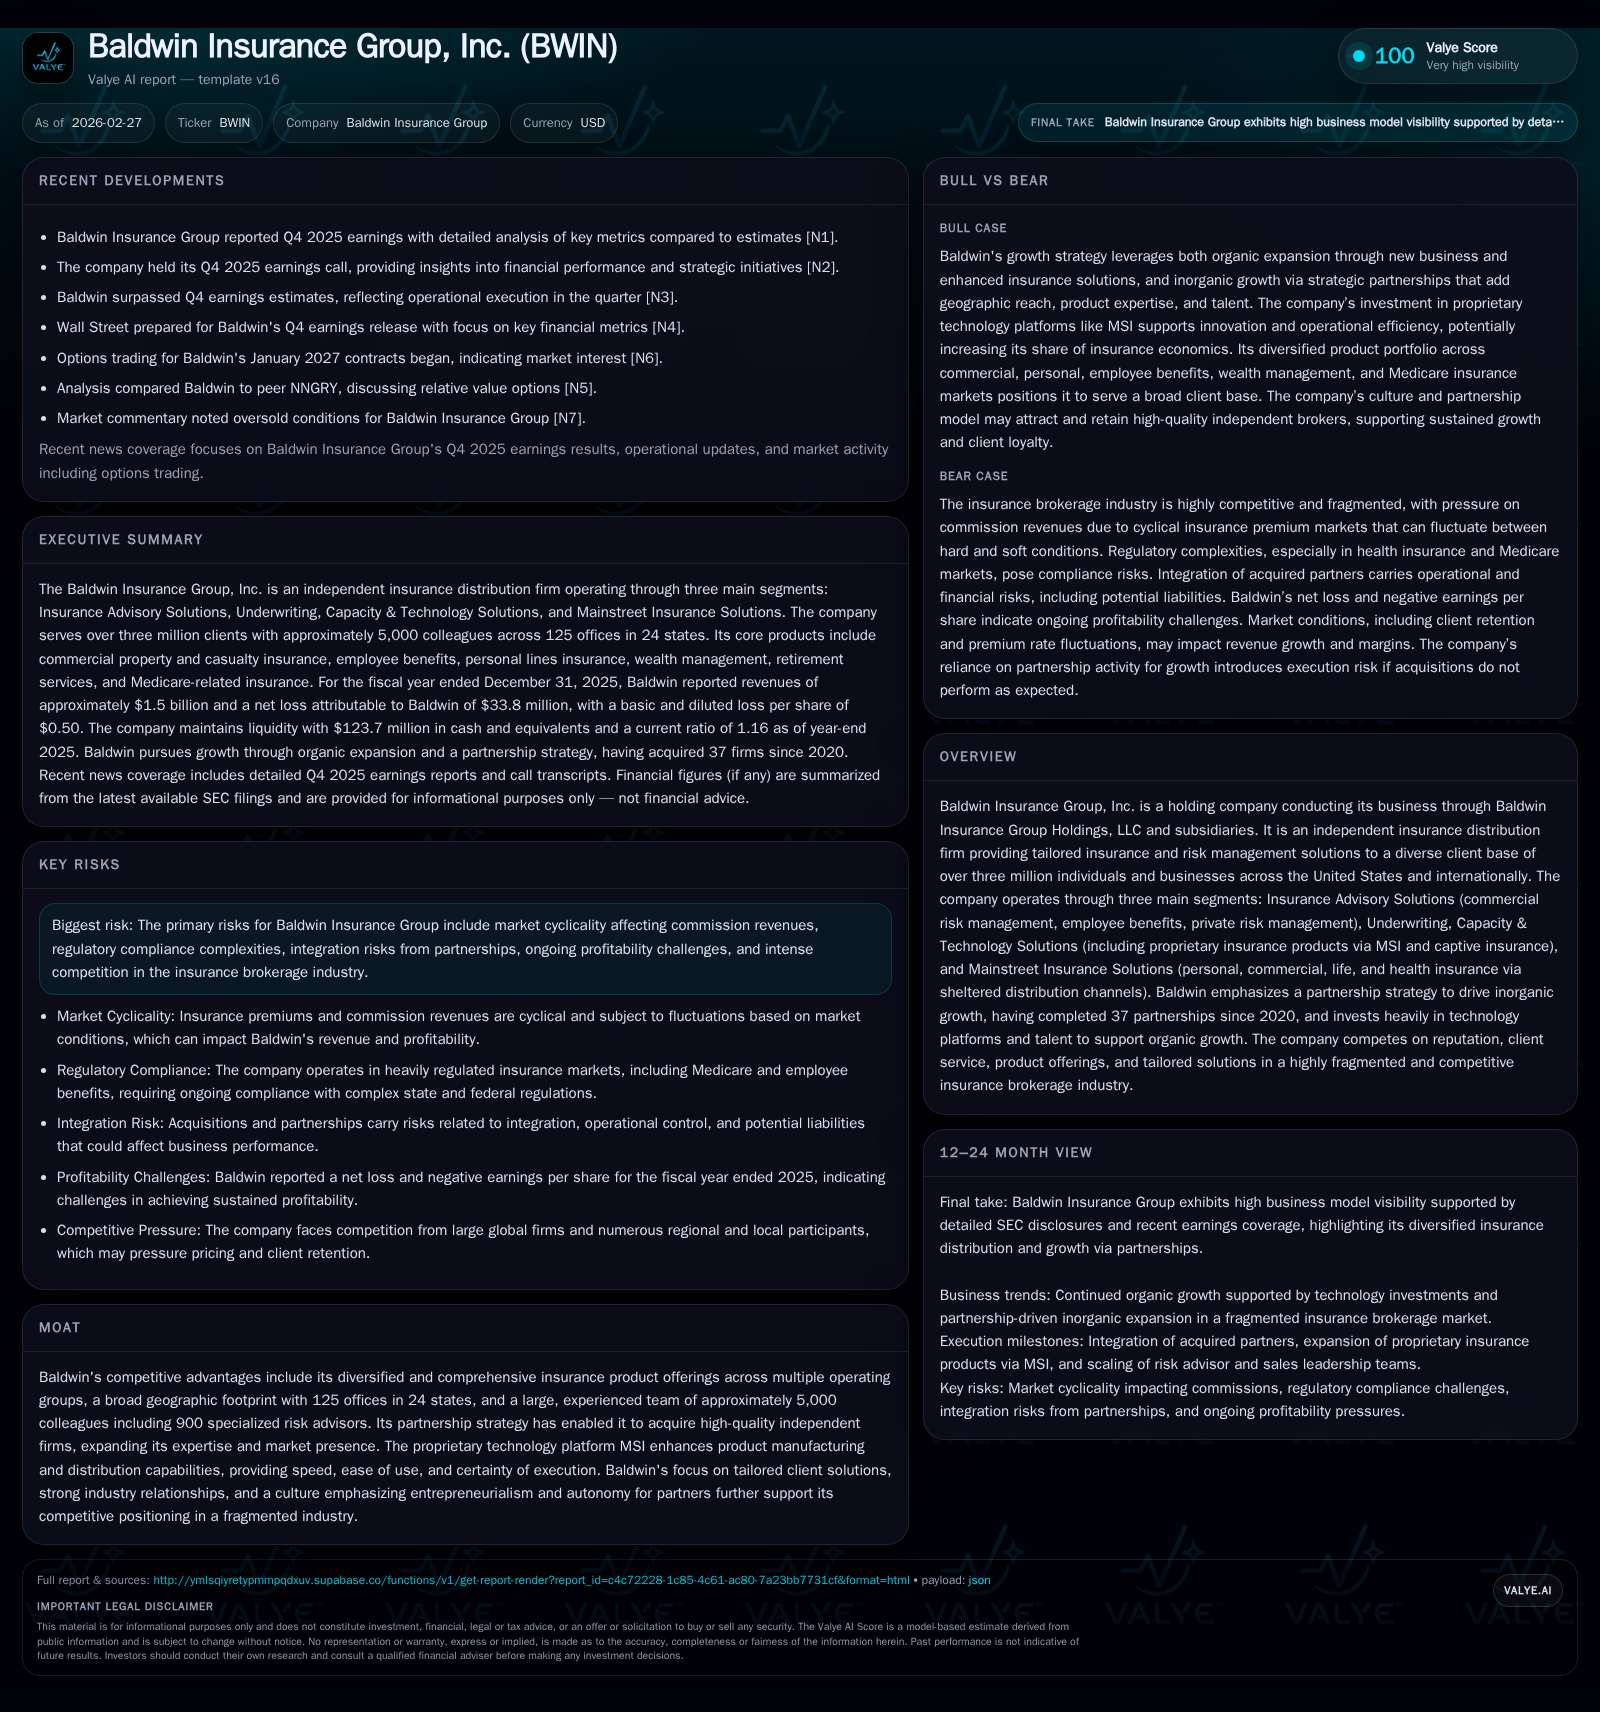
Baldwin Insurance Group’s 2025 financials showed top-line growth driven by core commissions and partnership acquisitions, pushing revenues to $1.5 billion, an 8% increase year-over-year. Despite improved operating income of $73.9 million (up nearly 22%), net losses deepened to $33.8 million due largely to elevated interest expense and acquisition-related costs. The company’s cash flow from operations turned negative by $29.4 million with continued capital investments and partnership payouts pressuring liquidity. Its balance sheet reflects significant debt refinancings and leverage to fund aggressive inorganic expansion through 37 partnerships since 2020 across a broad geographic footprint. Going forward, Baldwin’s growth prospects hinge on successful integration of new partners, management of financing costs, and sustaining organic commissions amid industry cyclicality.
Company Overview
Baldwin Insurance Group, Inc., operating through Baldwin Insurance Group Holdings, LLC and its subsidiaries, is an independent insurance distribution firm serving over three million clients across the U.S. and internationally [S1]. The company provides bespoke insurance advisory solutions spanning commercial risk management, employee benefits, private risk management; underwriting and proprietary insurance products via its MSI platform; as well as personal, commercial life, and health insurance distribution through its Mainstreet Insurance Solutions segment.
Founded on a culture codified by its Azimuth corporate constitution emphasizing entrepreneurial autonomy for partners, Baldwin’s competitive edge stems from its diversified product portfolio spread across three operating segments complemented by its proprietary manufacturing capabilities via MSI technology [S1]. This approach aims to deliver tailored client solutions while scaling through a focused partnership strategy that has yielded 37 partnerships since 2020.
Historical Financial Performance
The company’s revenue trajectory has been steadily positive over recent years as it blended organic commission growth with inorganic expansion via partnerships:
Historical performance (annual)
| FY | Rev ($mm) | Net ($mm) | CFO ($mm) | OpInc ($mm) | Rev YoY | Net YoY |
|---|---|---|---|---|---|---|
| 2025 | 1505 | -34 | -29 | 74 | +8.3% | -37.9% |
| 2024 | 1389 | -25 | 102 | 61 | +14.0% | +72.8% |
| 2023 | 1219 | -90 | 45 | -43 | -115.8% | |
| 2022 | -42 | -2 | -31 |
Source: SEC companyfacts cache [F1].
Capital returns and efficiency (annual)
| FY | FCF ($mm) | ROE% |
|---|---|---|
| 2025 | -5.6 | |
| 2024 | -4.2 | |
| 2023 | 23 | -16.1 |
| 2022 | -24 | -6.9 |
Source: SEC companyfacts cache [F1].
All figures rounded; net income negative values reflect ongoing losses [F1]
Revenues advanced by approximately $115.8 million year-over-year primarily reflecting organic core commission growth of roughly $114 million driven by new business wins across client industries and positive renewal trends in high-margin segments such as employee benefits [S1]. Partnerships contributed about $24 million incremental commissions as acquired firms were consolidated during the year.
Operating expenses grew alongside revenues with colleague compensation rising modestly (+2%) while other operating expenses increased sharply (+25%), largely due to investing in technology infrastructure enhancements (MSI platform) and incremental cost absorption related to partnership integrations [S1]. Amortization expense rose notably by nearly $19 million reflecting intangible assets recorded on acquisitions.
Despite wide operating profitability improvement ($73.9M versus $60.6M prior year), the bottom line remained negative at -$33.8 million due principally to high net interest expense totaling approximately $121 million stemming from significant debt load incurred to finance rapid growth initiatives including partnership capital calls [F1][S8]. Notably this interest expense declined slightly versus prior periods due to lowered average rates after refinancing but was offset by increased borrowings [S25].
Cash flow dynamics deteriorated significantly with operating cash flow turning negative (-$29.4M) compared to positive inflows ($102M) in the prior year period—a shift driven by elevated earnout payments owed for partner incentives surpassing accrued estimates plus additional working capital demands surrounding integration activity [F1][S17]. Capital expenditures remained stable near historical levels (~$21M), primarily directed toward software development costs linked to proprietary insurance product technology stacks supporting MSI growth [F1][S28].
Debt Profile and Capital Allocation
Baldwin employs a leveraged capital structure designed to fund aggressive inorganic expansion through partnerships:
- Senior Secured Notes: Approximately $600 million at a fixed coupon of ~7.125%, maturing May 2031.
- Term Loans: Approximately $1 billion variable-rate Term B loans bearing term SOFR plus margin (approximately 6.25% as of year-end), maturing May 2031.
- Revolving Facility: Up to $600 million; utilized approximately $107 million at year-end with available borrowing capacity near $477 million [S5][S7][S12].
The company executed multiple refinancings across calendar year 2025 increasing available leverage capacity by about $175 million incrementally used for funding partnerships and debt repayments [S15]. It also entered into a floating-to-fixed interest rate swap converting half of floating term loan exposure into fixed-rate commitments through September 2028 aiming for interest cost predictability [S12][S16].
Contractually mandated quarterly term loan amortizations are modest ($2.5 million per quarter) keeping principal repayment flexibility intact while the bulk is repayable at maturity over five years hence preserving near-term liquidity.
Baldwin's board has authorized up to a $250 million share repurchase program which currently remains inactive likely overshadowed by cash deployment needs toward partnerships and debt servicing [S9]. No formal dividends have been paid given ongoing losses.
Business Model Drivers & Growth Prospects
Organic Commission Growth:
Core commissions form the foundation of revenue generation derived from policy placement fees predominantly linked directly or indirectly to insurance premiums written for clients across various industries in the U.S. Growth is expected from continued client retention strength especially in segments like employee benefits where first-quarter renewals yield seasonally higher margins plus cross-selling complementary product lines via Mainstreet channels leveraging technology-driven efficiencies via MSI platform development.
Inorganic Growth via Partnership Strategy:
Baldwin pursues acquisition-like partnerships with existing independent agencies typically retaining entrepreneurial governance structures post-close while gaining Baldwin's distribution scale advantages. Since launching this aggressive partnership approach in 2020, the company completed over three dozen transactions increasing geographic coverage substantially—from earlier concentrated regional footprints into more than two dozen states today—and adding specialized talent pools nearing roughly 900 risk advisors nationwide offering domain expertise critical for complex client needs [S1][F1]. Incremental commissions from these deals contributed materially this cycle though integration risks remain an operational challenge.
Proprietary Product Development:
The MSI technology platform encapsulates Baldwin’s efforts toward vertically integrating underwriting functions allowing proprietary insurance product manufacture enhancing both pricing control and distribution speed relative to traditional brokerage intermediaries dependent solely on carrier offerings. MSI also actively supports captive insurance vehicles providing innovative alternatives for complex risk scenarios which can command superior margins over conventional commercial placements. Continued investment in platform capabilities denotes an ongoing commitment which could improve long-term unit economics if fully realized.
Risks & Challenges
- Market Cyclicality: As an intermediary largely reliant on commissions tied directly or prorated off premium volumes that fluctuate with economic cycles impacting insured asset valuations and hazard expectations.
- Integration & Scalability Risk: High frequency of partnerships presenting operational complexity requiring seamless cultural fit alignment plus IT system harmonization; costs related may temper near-term earnings leverage.
- Regulatory Environment: Evolving compliance demands governing insurance sales practices particularly around captive programs introduce potential legal/regulatory risks.
- Leverage & Interest Rate Exposure: Significant indebtedness necessitates disciplined free cash flow management; despite hedging measures residual rate volatility coupled with potential refinancing constraints could pressure interest costs further.
- Profitability Constraints: Persistent net losses underscore difficulty transitioning scale revenue gains into consistent net profitability indicating possible margin compression zones or inefficient cost structures needing strategic rebalancing.
What To Watch Forward (Analysis)
Without explicit company guidance disclosed publicly beyond December 31, monitoring should focus on:
- Quarter-over-quarter organic commission growth trends as a barometer for core business health outside acquired entities;
- Integration progress on January 2026 partnerships reflected in operational metrics;
- Interest expense trajectory linked closely with evolving debt balances against prevailing market rates;
- Cash flow improvements signaling better conversion of earnings into liquidity needed for sustaining future partnership ecosystem capital calls;
- EBIT margin expansions via controlled operating expense absorption;
- Any emerging disclosure around share repurchase activity utilization or dividend policy updates;
- Broader industry insurance market conditions affecting premium price adequacy amidst inflationary pressures or softening underwriting cycles.
Given the layered nature of Baldwin’s operations blending advisory services combined with manufacturing proprietary insurance products supported by substantial tech investments—the interplay between scale-enabled efficiency gains versus capital intensity of acquisitions will be a pivotal theme influencing medium-term valuation questions despite solid topline expansion currently observed.
Conclusion
Baldwin Insurance Group embodies a hybrid growth model prevalent among ambitious insurance brokers leveraging consolidation strategies married with technology innovation platforms designed to carve sustainable niches against traditional wholesaler networks. Their reported full-year results for FY2025 evidence healthy revenue momentum fueled largely by accumulated partnerships topping over three dozen since early decade start thereby confirming robustness in deal-sourcing capability aligned strategically with internal commissioning machinery scaling simultaneously. Nonetheless underlying profitability challenges remain steep mainly attributable to heavy interest burdens taken on financing such expansion plus elevated acquisition-related intangible amortization expenses clawing back much gross margin advances realized before corporate-level financial costs are met—intensifying scrutiny on cost discipline execution ahead. Operating cash flow shortfalls signal working capital pressures demanding cautious liquidity oversight going forward especially given cyclical risk profile inherent within their core client-premium base plus regulatory overlay tightening potential exposure angles. With roughly $600 million equity capitalization backing over approximately $1.7 billion total debt alongside hedging arrangements mitigating partial rate shock exposures—a balanced but still leveraged financial posture emerges typical yet demanding careful stewardship amid evolving macroeconomic conditions influencing insurance premium markets globally. In sum, Baldwin’s journey stands at a crossroads where maintaining scalable profitable integration cadence alongside organic book renewal success will dictate future returns trajectories beyond headline growth statistics alone indicative so far.
This report is provided solely for informational purposes based on publicly available data as of February 27, 2026. It does not constitute an offer or solicitation to buy or sell securities nor investment advice tailored to particular circumstances.
Disclaimer: This is research-only, informational analysis and not investment advice. It may include AI-generated interpretation and general industry context. Always verify important details using primary sources.
Comments