
Cato Corporation Posts Q1 Earnings Surge Fueled by Tariff Refunds and Same-Store Sales Gains
Cato’s recent quarterly results show improved profitability driven by tariff refunds and positive same-store sales trends despite persistent retail headwinds.
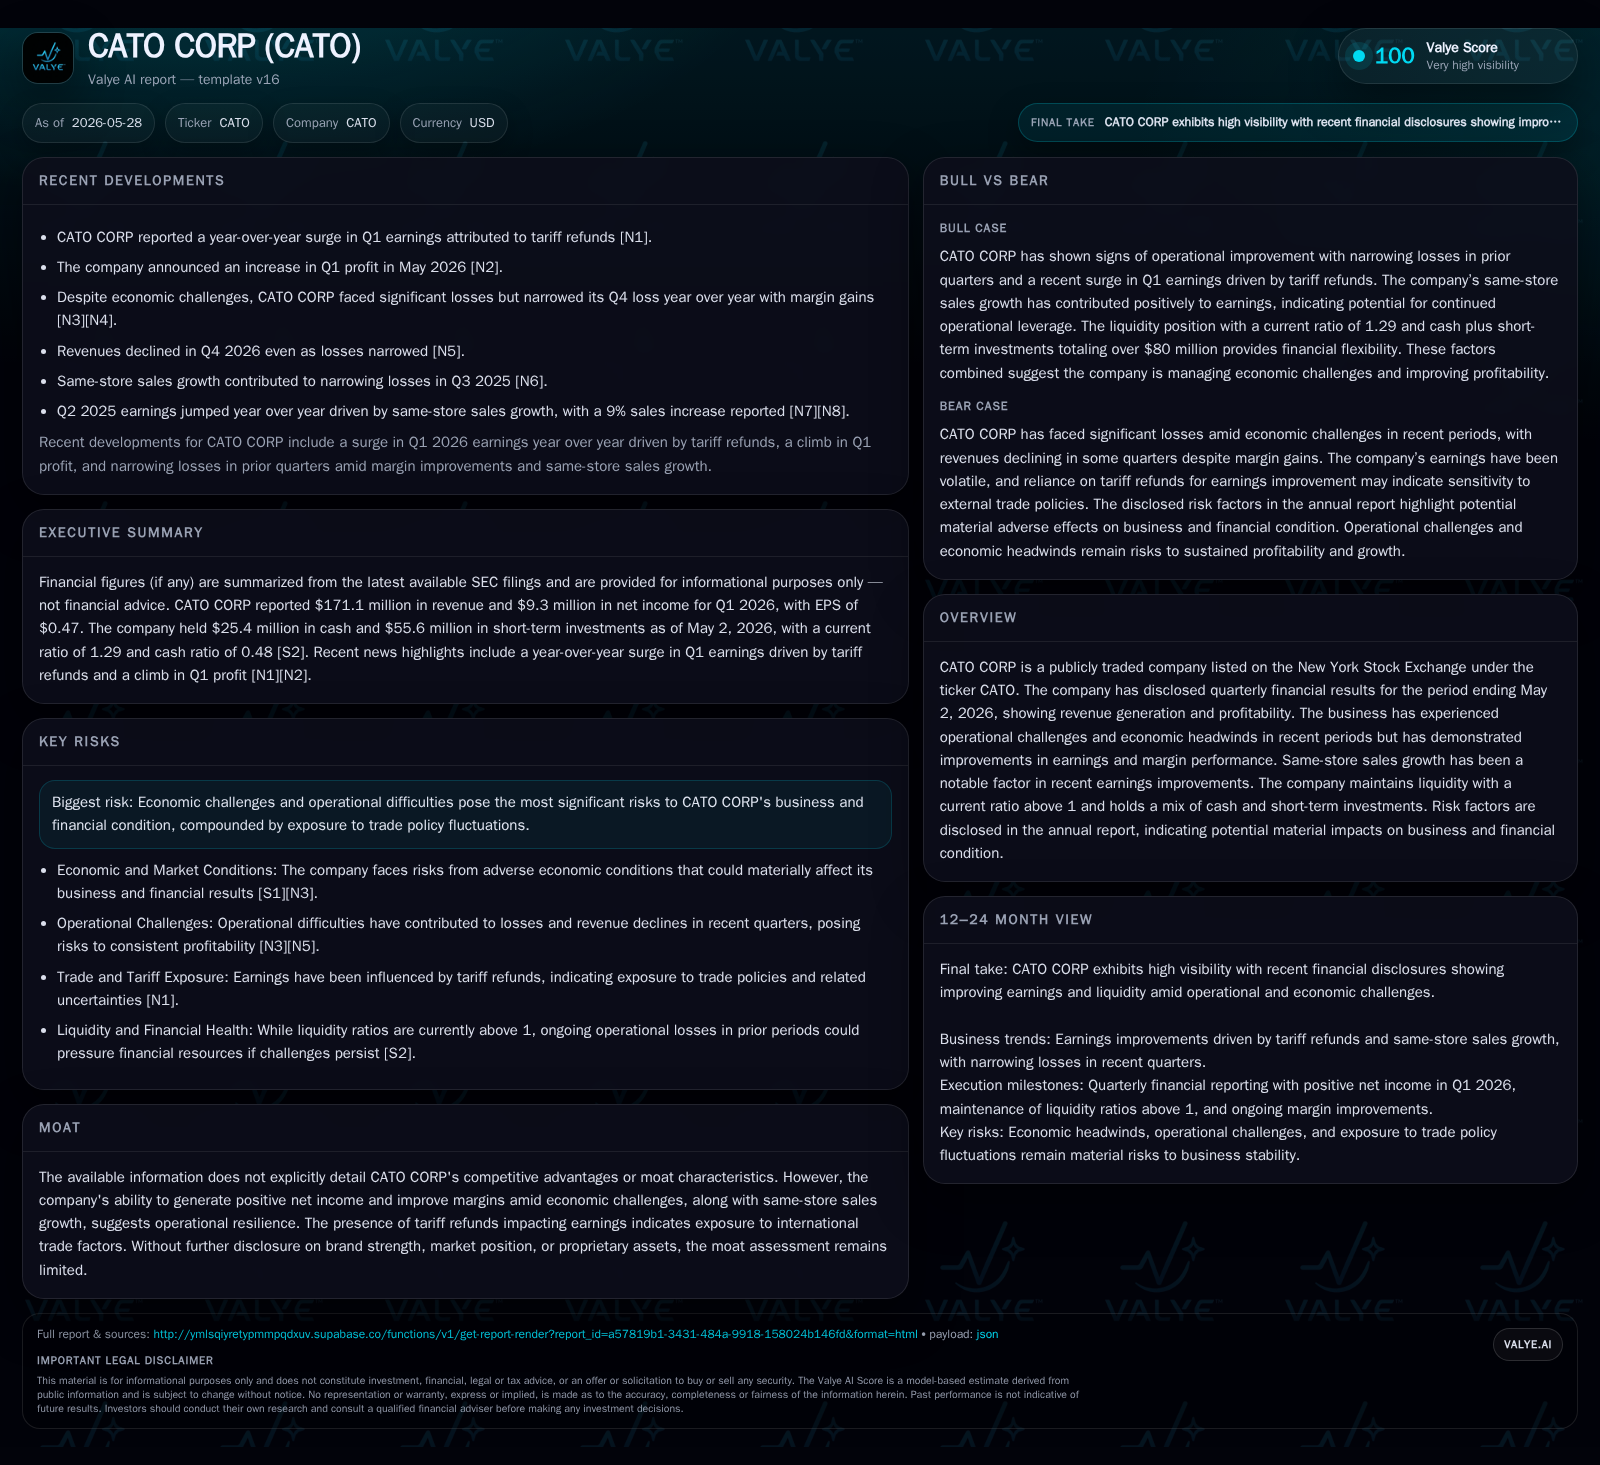
For the quarter ending May 2, 2026, Cato Corporation reported a notable improvement in earnings, underscored by tariff refunds and same-store sales growth in its core regional apparel stores. The company’s business model centers on predominantly private-label fashion merchandise targeting junior/missy and plus size customers, supported by proprietary credit offerings. While exposed to complex supply chain and trade policy risks due to offshore sourcing, Cato leverages operational data and merchandising coordination to sustain resilient demand. Looking ahead, margin sustainability post-tariff benefits and supply chain execution remain key focus areas amid broader economic uncertainty.
Latest Quarterly Operating Update: Earnings Surge and What It Means
In its first quarter ending May 2, 2026, Cato Corporation reported an earnings surge relative to prior periods primarily attributable to tariff refunds recognized during the quarter [S2][S3][N1][N2]. Despite lingering macroeconomic headwinds affecting the retail landscape, same-store sales continued their upward trajectory—an important indicator of sustained customer demand within its predominantly southeastern US footprint. This rare combination of a favorable one-time tariff reimbursement alongside operational execution improvements underpins the positive earnings revision. The company’s operating income remains challenged but shows signs of margin recovery after cost pressures experienced in preceding quarters.
Business Model and Merchandise Strategy: Private Label Focus and Credit Programs
Cato’s revenue derives principally from its network of approximately 1,069 specialty apparel stores focusing on juniors/missy and plus-size women's apparel complemented by men’s and children’s lines [S1]. A dominant portion of merchandise is sold under proprietary private labels sourced from various third-party manufacturers under strictly managed specifications, allowing greater control over product mix, pricing flexibility, and margin profiles.
The emphasis on value pricing combined with coordinated assortment presentation enables ease of outfit selection for shoppers—a strategic advantage in driving repeat visits in strip-mall anchored locations. Additionally, Cato operates an in-house credit card program which historically accounted for about 3.4% of retail sales as observed through recent years [S1]. This credit offering supports customer purchasing power while requiring careful management of default risk; bad debt ratios have fluctuated between 3.6% to 4.9% of credit sales annually.
Competitive Landscape: Positioning Within Regional Specialty Apparel Retail
Cato competes mainly against department stores, mass discounters, and other regional specialty chains, carving out a niche with localized market familiarity across its store base concentrated primarily in the southeastern United States [S1][N3]. Its positioning as an anchor tenant in strip shopping centers near dominant grocery or discount retailers provides steady foot traffic channels but also intensifies pricing competition.
Though the filings do not explicitly denote a sustainable moat or significant proprietary brand equity outside its private labels, consistent same-store sales improvement signals operational resilience against sector-wide headwinds. The lack of vertically integrated manufacturing places Cato at potential risk for supply inflexibility compared to some peers but allows asset-light scalability.
Supply Chain Dynamics and Pricing Pressure: Tariffs, Freight Costs, and Inventory Flow
Cato sources much of its inventory overseas with concentrations in Southeast Asia and Egypt [S1]. This exposes the company to variable costs driven by geopolitical tensions impacting tariffs as well as international shipping disruptions notably those affecting vessels transiting the Suez Canal due to Middle East hostilities—forcing rerouting around the Cape of Good Hope with longer lead times.
These factors have contributed to elevated ocean freight expenses coupled with additional surcharges including facility fees and fuel cost inflation. Moreover, domestic supply chain challenges such as port congestion, limited drayage capacity, and scarce truck drivers further complicate timely merchandise arrivals [S1]. Although tariff refunds helped mitigate cost escalation effects in the recent quarter, ongoing volatility in trade policy represents a material source of uncertainty for procurement cost stability.
Drivers of Growth: Same-Store Sales Trends and Digital Integration
Same-store sales growth remains a cornerstone driver underpinning top-line resilience [S1][S2]. Management employs daily financial dashboards coupled with weekly analytical reports that contrast actual versus planned sales figures enabling more agile buying decisions. These tools assist in optimizing weeks-of-supply metrics at granular levels by store and category facilitating tighter inventory management.
Merchandise assortments are curated carefully emphasizing color coordination and trend alignment particularly within junior/missy apparel spaces where style currency is critical [S1]. The company’s e-commerce platforms complement brick-and-mortar efforts providing access to broader assortments including elevated fashion segments through Versona’s Cache brand.
Risks and Constraints: Trade Policy Exposure, Economic Headwinds, and Operational Challenges
Trade-related risks dominate Cato's profile given significant reliance on overseas production susceptible to tariffs, sanctions, or export restrictions that may raise costs or restrict product availability [S1][S2]. Supply chain fragility—with cascading delays from foreign port congestion through domestic transportation bottlenecks—exerts upward pressure on inventory carrying costs.
Furthermore, economic uncertainties influencing consumer discretionary spending could constrain apparel purchases given industry cyclicality. Limited vertical integration reduces supply control agility versus vertically integrated competitors. Pricing pressures intensified by discount chains also limit margin expansion ability despite private label cost advantages.
Management highlights these headwinds explicitly among principal risks suggesting ongoing vigilance is warranted regarding geopolitical events impacting trade regimes and domestic logistics conditions [S2].
Forward-Looking Indicators: Monitoring Guidance and Execution Milestones
While explicit forward guidance is modestly constrained in public disclosures [S2][S3], key milestones for observers include monitoring subsequent quarters' same-store sales comparisons for confirmation of demand momentum beyond one-time tariff effects. Equally critical will be evaluating whether gross margin improvements persist once tariff refunds normalize.
Operational cadence focusing on timely merchandise receipt supported by IT-enabled dynamic purchasing oversight remains central to managing product flow effectively amidst ongoing shipping challenges [S1]. Potential announcements related to enhanced supply chain partnerships or new merchandise initiatives should be tracked tightly.
Summary Financial Profile: Profitability, Liquidity, and Operational Efficiency
As of May 2, 2026 quarter-end data reveal that although net income remained slightly negative at approximately -$5.9 million, this reflects a marked improvement driven partly by tariff reimbursements offsetting prior cost burdens [F1][S2]. Operating income losses narrowed accordingly.
Liquidity appears sound with a current ratio exceeding 1.2 at 1.29 supported by $25.4 million in cash alongside $217 million in current assets against $168 million current liabilities [F1]. This balance sheet positioning grants reasonable short-term flexibility amid external uncertainties.
Overall operational performance indicates cautious recovery supported by disciplined expense management alongside stable customer purchasing patterns bolstered via proprietary credit programs.
This analysis synthesizes information from the latest SEC filings released between March and May 2026 alongside recent news reports. It reflects facts available through cited sources without conjecture beyond documented disclosures. Readers are encouraged to review referenced documents for further detail.
Disclaimer: This is research-only, informational analysis and not investment advice. It may include AI-generated interpretation and general industry context. Always verify important details using primary sources.

Comments