
CAVA Group’s Expansion Drive Highlights Strengths and Emerging Challenges
Examining how CAVA's growth ambitions are reflected in financial outcomes and operational initiatives amid intensifying market competition.
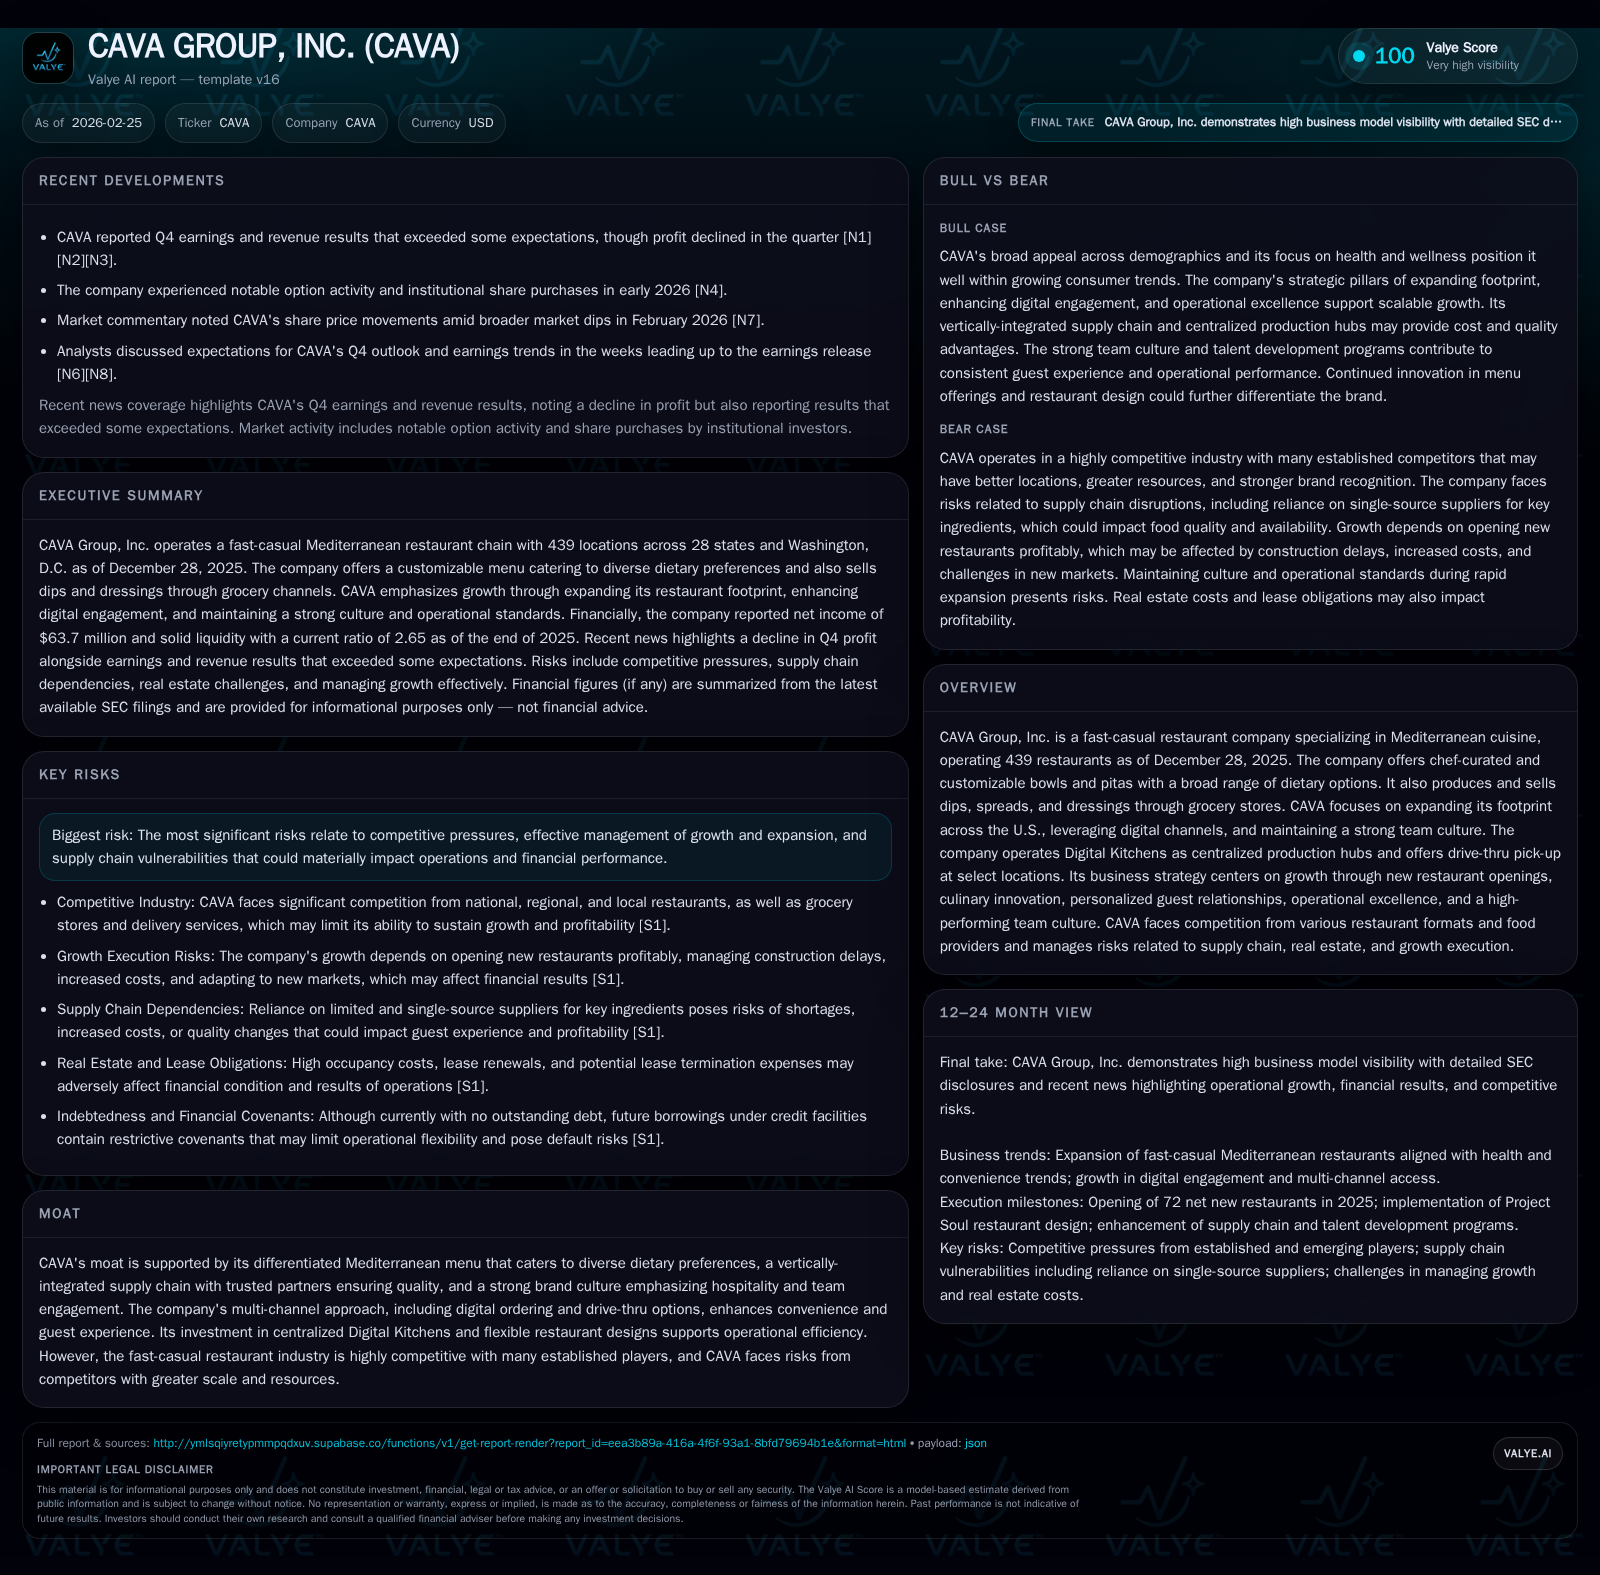
CAVA Group, Inc. has rapidly expanded its footprint to 439 restaurants across 28 states by end-2025, leveraging its unique Mediterranean brand and digital innovation. Despite a strong 28% operating income increase in fiscal 2025, net income halved year-over-year, reflecting rising capital expenditures, operational scaling costs, and competitive pressures. The company’s multi-channel strategy—incorporating digital kitchens, drive-thru formats, and grocery presence—positions it for continued growth towards a >1,000 restaurant target by 2032. However, constrained by debt covenants and supply chain risks, CAVA faces balancing near-term profitability pressures against its aggressive expansion.
Trajectory of Operational Growth: From Modest Beginnings to New Restaurant Footprint
Founded in 2011 with a single location in Bethesda, Maryland, CAVA Group has executed an aggressive expansion strategy culminating in the operation of 439 restaurants by December 28, 2025 (S1). This represents rapid scaling across 28 states plus Washington D.C., implying a substantial compound annual growth rate in store count over roughly a decade [F1]. Complementing the restaurant base is the company's grocery products line—including dips, spreads, and dressings—produced centrally at their Digital Kitchens facilities (S8). This vertical integration supports supply chain control and product consistency.
The company’s Mediterranean-focused menu caters broadly across dietary preferences—inclusive of vegan, keto, paleo, gluten-free options—offering over 17 billion possible combinations from customize-your-own bowls and pitas (S8). This product diversification feeds into multiple dayparts and customer segments.
Operational leverage emerges through the deployment of Digital Kitchens—centralized commissary hubs producing core components which reduce variability and labor intensity at physical locations while allowing faster rollouts (S1). The model supports modularity in new restaurants' designs ranging between approximately 2,000–3,000 square feet scaled for local demographics (S16).
Competitive Pressures in Mediterranean Fast-Casual: The Market Terrain
CAVA occupies a highly competitive fast-casual segment where larger peers benefit from economies of scale and established market presence (S6). Competitors range from traditional limited service restaurants to grocery channels competing on dips/spreads shelf space and delivery platforms vying for digitally-driven customer acquisition.
This multi-front competition intensifies pressure on channel access—both physical site presence amid prime real estate scarcity and digital visibility through apps or third-party food delivery services (S6). Additionally, competitors with deeper pockets may outspend CAVA on marketing or discounting strategies or adapt more swiftly to changing consumer dietary trends.
Brand differentiation remains pivotal given risks of concept imitation; peers may mimic menu items or marketing approaches eroding CAVA’s unique positioning based on authentic Mediterranean culinary heritage combined with health-conscious appeal (S6).
Scaling Kitchens and Digital Channels: Pillars of Future Expansion
Strategically central to CAVA's growth is its investment in automation-enabled Digital Kitchens which streamline prep work en masse but retain flexibility for individualized meal customization (S1). This approach mitigates bottlenecks common in large-scale fast casual rollouts by reducing dependency on skilled labor at each site.
Concurrently, enhanced digital infrastructure—including the proprietary CAVA app and website—forms a 'digital ecosystem' driving personalized guest communication through advanced loyalty programs focused on repeat visits and data-driven menu innovation (S1)(N1)(N2). Drive-thru pick-up capabilities now available at about 75 locations further extend convenience-based access typical of broader QSR industry trends (S16).
Looking forward, management targets more than doubling current unit count to exceed 1,000 U.S. restaurants by 2032 under these multi-channel growth pillars (S8).
Financial Performance Snapshot: A Mixed Picture of Income and Cash Flow
Fiscal year 2025 saw CAVA’s operating income rise by an impressive +28.2% year-over-year to $55.3 million yet net income paradoxically declined sharply by over half (-51.1%) to $63.7 million [F1]. This divergence suggests elevated non-operating expenses such as interest or one-time charges impacting bottom-line profitability despite core business momentum.
Operating cash flow also grew robustly by ~14.8% to $184.8 million supporting working capital needs during rapid expansion phases (F1). However, this period was marked by a notable +46.8% jump in capital expenditures to nearly $159 million mainly fueling new restaurant openings and Digital Kitchens build-out (F1)(S11).
The net effect delivered an approximate return on equity ratio near 8.2%, indicating modest shareholder profitability as much cash is redeployed into growth projects rather than distributed dividends or buybacks; indeed, no dividends were paid in recent years while stock repurchases have been minimal (~$3M in FY2023 only) [F1].
Liquidity remains healthy with a current ratio around 2.65 based on assets ($431M) well exceeding current liabilities ($163M), reflecting prudent working capital management even as capital structure restrictions persist under credit facilities (F1)(S4)(S5).
Capital Allocation Priorities: Investment, Debt Constraints, and Returns
CAVA’s capital allocation heavily favors reinvestment into new site acquisitions and enhancement of operational assets like Digital Kitchens rather than returning cash to shareholders (F1)(S11). Its revolving credit facility—with undrawn availability of $74 million as of late-2025—is subject to covenants which preclude dividends or significant share buybacks without lender approval (S4)(S5)(S7).
These covenants also restrict asset disposals or incurrence of additional debt that could otherwise accelerate growth or fund acquisitions externally but at heightened financial risk.
For investors accustomed to yield-generating equities within consumer segments such as restaurants or retail chains, this underscores an ongoing reinvestment phase wherein cash flow prioritizes capex over dividend payouts—a hallmark alignment with early-stage scaling companies seeking market share (F1).
Momentum Ahead: What Wall Street and Analysts Are Watching Next
Recent earnings beats reported by CAVA [N2] have been tempered by profit declines discussed both publicly [N8] and flagged by analyst caution ahead of quarterly reporting [N5]. These underscore the mixed signals investors face balancing sales momentum against margin compression.
Key industry metrics under close watch include same-store sales growth rates—which encapsulate organic traffic dynamics—and gross margin resilience amid cost inflation pressures notably labor wage hikes common across food service sectors post-pandemic N11. Rising commodity costs for core ingredients feeding into dips/spreads also threaten margin stability.
Digital ordering uptake remains critical given increasing share of revenue via convenience-oriented channels that command different cost structures from dine-in formats [N1].
Risks from Supply Chain to Brand Imitation: Navigating Market Challenges
Notable risks stem from reliance on limited or single-source suppliers for key quality ingredients such as custom olive oil blends or specialty meats integral to brand promise; disruptions here can produce menu shortages forcing substitutions detrimental to guest experience (S12)(S15).
Moreover, emerging competitors mimicking the Mediterranean health-forward formula threaten erosion of brand distinctiveness impacting pricing power (S10)(S29). Inflationary input cost surges coupled with regulatory demands—pertaining both to food safety standards and evolving privacy laws governing digital marketing channels—compound operational complexity (S13)(S19)(S20).
Labor market tightness elevates wage expense further pressuring margins despite automation initiatives aimed at labor productivity gains (S18)(S23).
Operational Excellence as a Differentiator: Technology, Training, and Culture
CAVA places significant emphasis on training regimes deploying Academy General Managers charged with ensuring consistency across locations enhancing hospitality standards aligned with its "Mediterranean Way" ethos (S18). This people-centric culture is quantified via high Employee Net Promoter Scores conveying strong team engagement—crucial amidst high turnover environments endemic to quick-service sectors.
Technological adoption includes automation both front-of-house—for order assembly efficiency—and back-of-house processes optimized through data analytics unlocking insights around restaurant yield optimization metrics enabling scalability while maintaining quality norms (S17)(S18).
This dual focus on culture at scale combined with technology is critical given fierce competition where service level standardization can be a decisive differentiator sustaining guest loyalty beyond mere product novelty.
Historical Financial Summary
Historical performance (annual)
| FY | Net ($mm) | CFO ($mm) | OpInc ($mm) | Capex ($mm) | Net YoY |
|---|---|---|---|---|---|
| 2025 | 64 | 185 | 55 | 159 | -51.1% |
| 2024 | 130 | 161 | 43 | 108 | +881.3% |
| 2023 | 13 | 97 | 5 | 139 |
Note: Omitted columns lack sufficient annual XBRL coverage in the provided tags (need ≥2 annual points): Rev, Div, Buybacks. Source: SEC companyfacts cache [F1].
Capital returns and efficiency (annual)
| FY | FCF ($mm) | ROE% |
|---|---|---|
| 2025 | 26 | 8.2 |
| 2024 | 53 | 18.7 |
| 2023 | -42 | 2.3 |
Source: SEC companyfacts cache [F1]. Note: Revenue not available; Dividends not disclosed; Buybacks minimal at ~$3M in FY2023 only
This table illustrates sharp volatility characteristic of rapid scaling phases where operating results improve but bottom-line fluctuates due to capital intensity.
Disclaimer: This analysis is based solely on publicly available financial data filed with the SEC ([F1],[S1],[S4],[S5]) and related news sources ([N1],[N2],[N5],[N8]) up through February 25th, 2026. It does not constitute investment advice or recommendations regarding securities of CAVA Group or any other entity.
Disclaimer: This is research-only, informational analysis and not investment advice. It may include AI-generated interpretation and general industry context. Always verify important details using primary sources.

Comments