
CBRE Group Accelerates Resilient Growth with Outperformance in Leasing and Capital Markets
CBRE's Q1 2026 results show momentum in leasing and capital markets reinforcing its strategic pivot to resilient revenue streams.
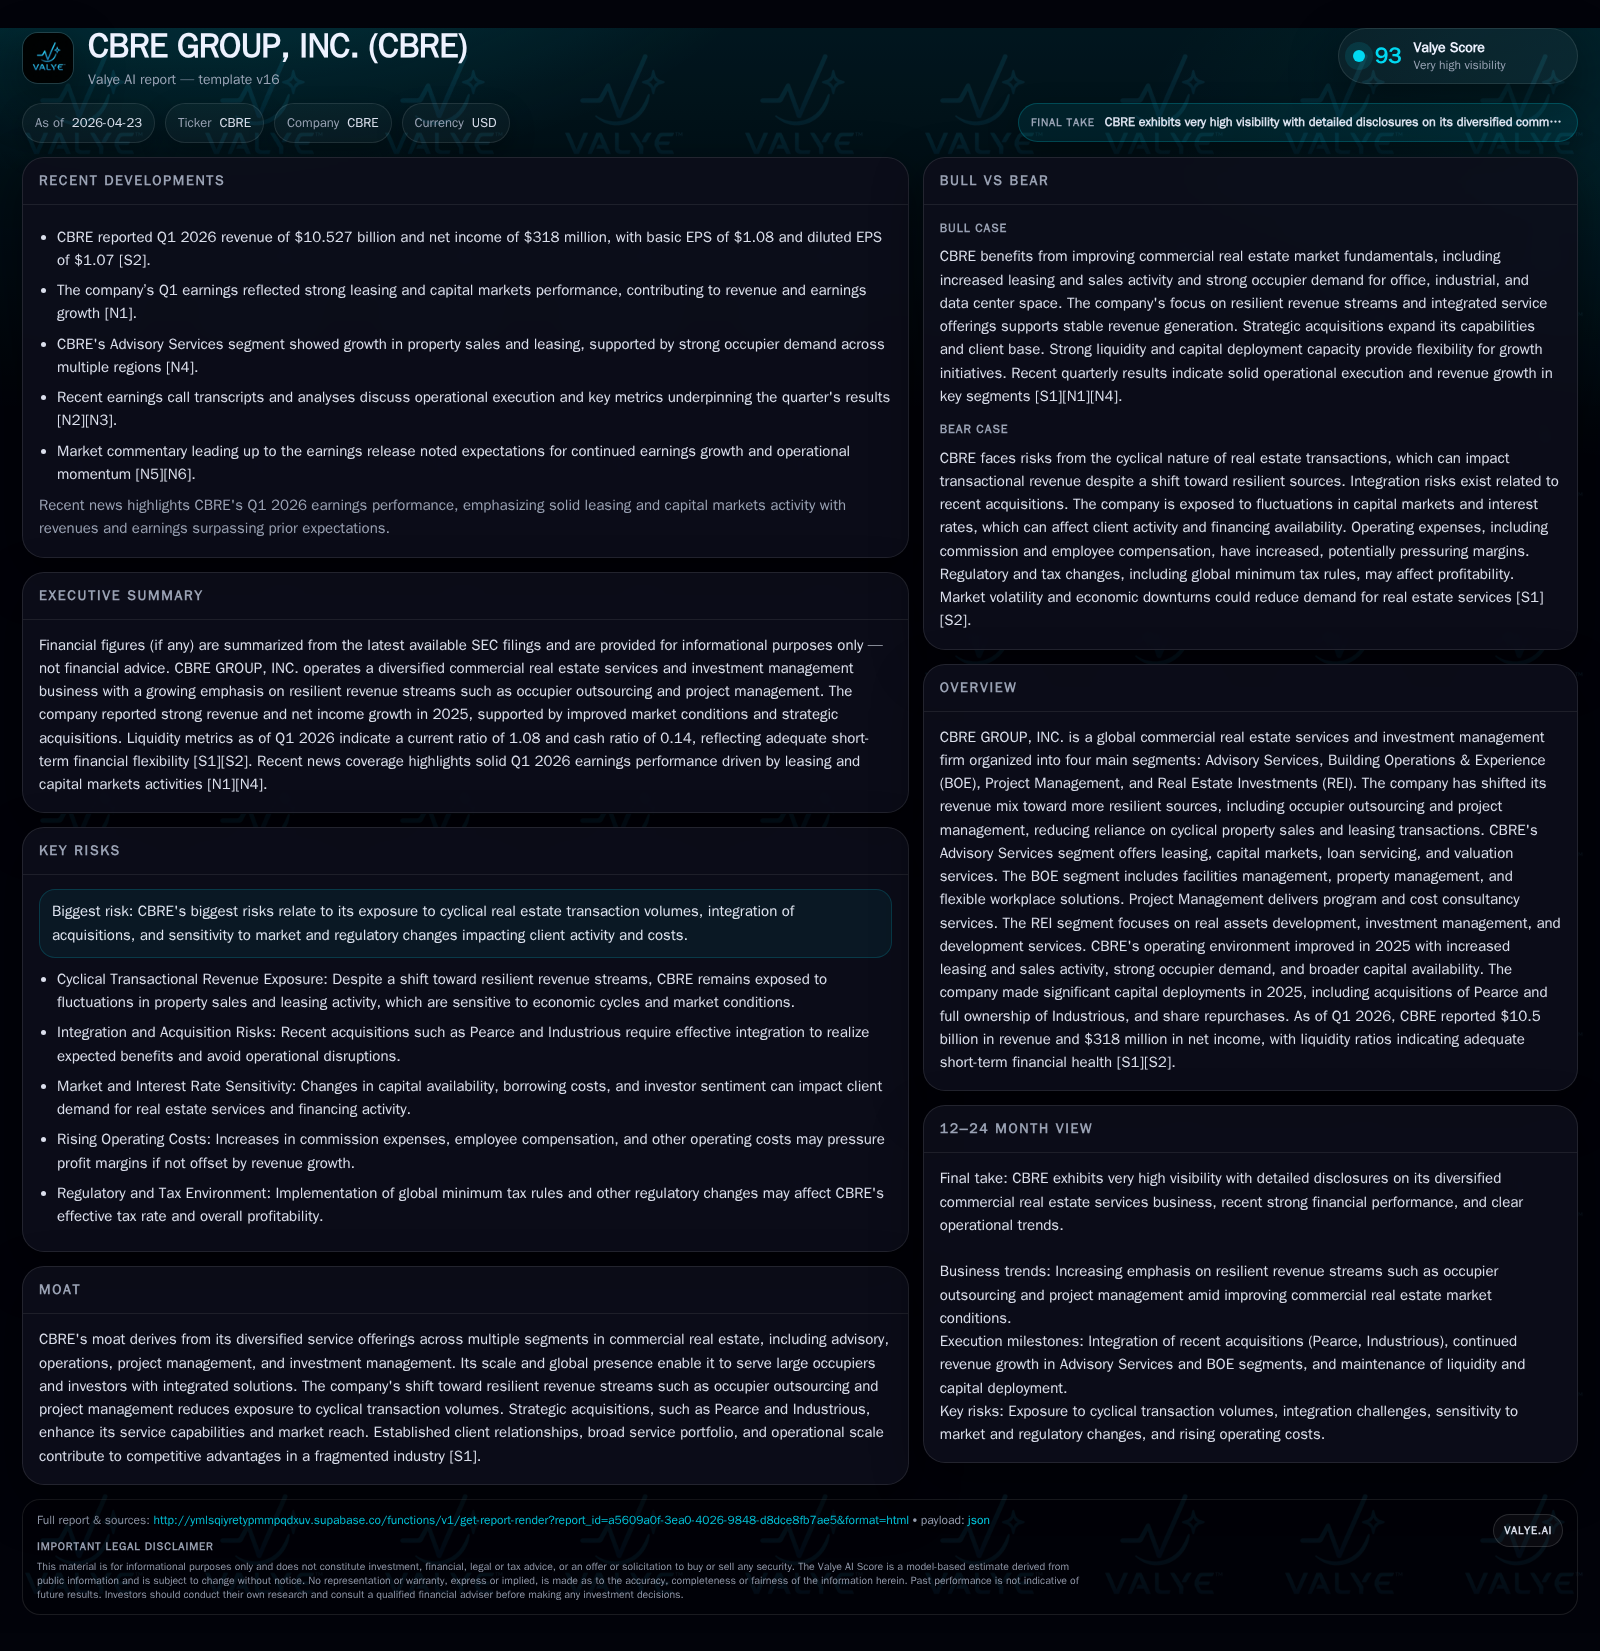
CBRE Group's latest quarterly filing for Q1 2026 reveals robust revenue growth driven by strong leasing activity and capital markets performance, affirming its shift toward more stable, outsourcing- and project management-based revenues. This diversification reduces exposure to traditional cyclical transaction revenue, positioning CBRE well within the competitive global commercial real estate services industry. Key growth drivers include increasing occupier outsourcing demand and integration of recent acquisitions like Pearce and Industrious. Financially, CBRE maintains solid liquidity with a current ratio above 1 and manageable debt levels as of March 2026.
Latest Quarterly Operating Update: Highlights from Q1 2026
CBRE's first quarter 2026 results, disclosed in the April 23, 2026 Form 10-Q [S2], underscore a continuation of positive momentum established throughout 2025. The firm reported revenue growth propelled by particularly robust activity in its leasing operations and capital markets businesses—a finding corroborated by multiple contemporaneous market reports [N1], [N4]. This strength signals an improved commercial real estate operating environment characterized by rising occupier demand across office, industrial, and data center sectors alongside healthier financing markets.
The quarter's topline gain is notable given CBRE's strategic emphasis on growing more resilient revenue streams such as occupier outsourcing services (including facilities management) and project management solutions, which have comparatively lower sensitivity to transaction volume cycles. The dilution of reliance on historically volatile property sales and leasing commissions mitigates earnings cyclicality risk. Execution in the first quarter reflects progress against this strategic shift with increased recurring contract wins.
Importantly, the firm confirms that elevated leasing velocity—particularly within key U.S. metropolitan hubs—and strengthening capital markets activity have boosted transactional commissions while supporting upsell opportunities into higher-margin outsourcing offerings. This synergy between traditional transactional work and integrated service expansion is a critical dynamic underpinning near-term operating leverage.
Business Model and Service Offerings: Diversification and Economic Moat
CBRE operates through four principal segments: Advisory Services, Building Operations & Experience (BOE), Project Management, and Real Estate Investments (REI) [S1]. Its business model combines transactional commissions derived from brokerage activities—sales, leasing, mortgage origination—with recurring fee-based revenue from portfolio-wide outsourcing contracts encompassing facilities management, property management, valuation services, loan servicing, project oversight, and investment management.
The firm's moat arises from this multidimensional service portfolio enabling end-to-end solutions that reduce client switching costs and generate operational scale benefits across over 100 countries served by approximately 155,000 employees globally [S1]. Noteworthy recent investments include:
- The acquisition of Pearce Services for $1.2 billion expands CBRE’s technical capabilities in digital power infrastructure—a critical growth area to support data centers and technology-intensive real estate tenants.
- Complete equity acquisition of Industrious ($468 million) enhances the flexible workplace platform catering to evolving occupier space needs.
This diversity transitions CBRE away from volatile transaction fees towards more steady outsourcing streams that deliver higher visibility revenue with longer contract durations. It also integrates an asset light investment management arm delivering carried interest and incentive fees tied to fund performance.
Operationally, commissionable brokerage revenues retain seasonal patterns but their contribution to total revenue has declined proportionally compared to more resilient lines like project management and facilities outsourcing whose recurring fees smooth earnings variability [S1]. The cross-segment client engagement amplifies opportunities for multi-service contracts fostering deeper customer relationships.
Industry Positioning: Scale, Competition, and Market Fragmentation
Within the global commercial real estate ecosystem, CBRE holds a commanding presence as the largest provider by revenue [S1]. Its scale affords significant competitive advantages including:
- Ability to serve large institutional investors and corporate occupiers worldwide under unified platforms.
- Extensive geographic footprint providing local market expertise combined with global transaction capability.
- Broad service breadth spanning advisory brokerage through building operations enabling integrated client solutions.
The broader industry remains highly fragmented with numerous regional boutique firms focusing narrowly on specialized services or geographies. Against this backdrop, CBRE’s comprehensive offerings coupled with recent bolt-on acquisitions create high entry barriers related to brand trust, technological integration (e.g., Pearce’s digital infrastructure expertise), and human capital scale.
Competition varies by segment; in brokerage it faces major peers like JLL or Cushman & Wakefield while technical facilities management competes with both focused third-party operators and captive internal teams at large occupiers. CBRE’s flexible workspace unit operates in a rapidly evolving landscape where agile office demand shapes landlord-tenant dynamics.
Regulatory factors concerning environmental standards, leasing transparency requirements, data security (notably through its cybersecurity governance overseen by CISO teams per S1 Risk Factors) increasingly influence operational discipline across all segments.
Key Growth Drivers and Emerging Constraints
CBRE’s growth avenues align well with structural shifts in commercial real estate:
- Rising Occupier Outsourcing: Large corporations increasingly outsource facility management functions to focus on core competencies while seeking cost efficiencies—driving demand for BOE services.
- Data Center Leasing Boom: Expansion of cloud computing fuels specialized tenant demand requiring technical expertise supported via Pearce acquisition.
- Project Management Complexity: Increasingly sophisticated real estate developments create opportunities for high-value consultancy roles overseeing lifecycle costs.
- Cross-Selling Synergies: Integrated service capabilities enable bundle offerings boosting wallet share beyond standalone brokerage or management assignments.
However, potential constraints persist:
- REI segment remains exposed to cyclicality inherent in property development profits and carried interest which can fluctuate materially with capital market conditions.
- Inflationary pressures on labor costs may compress margins particularly within labor-intensive facilities management contracts unless absorptive pricing power exists.
- Integration risk from sizable acquisitions demands effective cultural alignment and systems harmonization; execution lapses could impair anticipated synergies.
- Regulatory compliance costs related to ESG initiatives or government contracting introduce incremental expense layers needing careful navigation.
Forward-Looking Indicators: What Investors Should Watch
Moving forward, key milestones will inform assessments of CBRE’s trajectory:
- Updated financial guidance reflective of Q2 demand outlook particularly around transactional volumes versus outsourcing contract renewals [S2].
- Announcement of significant new contract awards or extensions in occupier outsourcing or project management pipelines indicative of sustained uptake.
- Margin trend data highlighting operating leverage realized from shifting product mix alongside inflationary cost offsets.
- Regulatory developments impacting property transactions or financing availability especially if affecting capital markets activity.
- Progress reports on integration outcomes from Pearce’s advanced technical services platform as well as Industrious flexible workplace expansion efforts [N2], [N3].
Monitoring quarterly cadence of commercial leasing deal velocity among large corporates plus capital raising transactions will act as barometers for cyclical sensitivity amidst broader macroeconomic uncertainties.
Financial Profile Summary: Supporting Evidence from Recent Filings
From a balance sheet perspective as of March 31, 2026 per company facts data [F1]:
| Metric | Amount ($M) |
|---|---|
| Cash & Equivalents | 1,664 |
| Total Debt | 5,149 |
| Net Debt | ~3,485 |
| Current Assets | 12,734 |
| Current Liabilities | 11,753 |
| Current Ratio | 1.08 |
CBRE maintains compliance with all debt covenants as indicated in its latest annual filings covering multiple senior unsecured notes mature through mid-2030s at fixed rates ranging from ~2.5% to near 6% interest [S4]-[S20]. The firm successfully refinanced maturing debt instruments ahead of schedule during 2025 enhancing maturity profile stability.
Fiscal year ended December 31, 2025 reflected robust financial growth vs prior year [F1]:
Historical performance (annual)
| FY | Rev ($bn) | Net ($mm) | CFO ($mm) | OpInc ($mm) | Rev YoY | Net YoY |
|---|---|---|---|---|---|---|
| 2025 | 40.5 | 1157 | 1559 | 1753 | +13.4% | +19.5% |
| 2024 | 35.8 | 968 | 1708 | 1413 | +12.0% | -1.8% |
| 2023 | 31.9 | 986 | 480 | 1117 | +3.6% | -29.9% |
| 2022 | 30.8 | 1407 | 1629 | 1512 |
Source: SEC companyfacts cache [F1].
Capital returns and efficiency (annual)
| FY | Buybacks ($mm) | ROE% |
|---|---|---|
| 2025 | 968 | 13.0 |
| 2024 | 627 | 11.5 |
| 2023 | 665 | 11.9 |
| 2022 | 1850 | 17.9 |
Source: SEC companyfacts cache [F1].
Revenue grew +13.4% year-over-year underpinned by double-digit expansion in resilient fee lines alongside capital markets-led commission gains. Operating income jumped more than +24% YoY signaling strong operating leverage achieved via scale benefits amid controlled cost structures [F1].
Free cash flow generation approximated $1.3 billion reinforcing capacity for sustained investments in strategic acquisitions plus shareholder returns including stock repurchases totaling almost $1 billion in FY25 alone [S26].
This financial flexibility supports ongoing selective deployment into high-growth segments while managing leverage metrics consistent with the firm’s historical financial discipline.
This analysis is for informational purposes only based strictly on publicly available SEC filings and recent credible reports without any investment recommendation implied or expressed.
Disclaimer: This is research-only, informational analysis and not investment advice. It may include AI-generated interpretation and general industry context. Always verify important details using primary sources.
Comments