
Cerus Corp’s Profitability Challenge: Can Operational Progress and FDA Milestones Drive a Turnaround?
Cerus Corp’s recent operational updates show a company with reported liquidity position and a steady cadence of FDA milestones, but ongoing net losses and limited visibility into pipeline or market adoption keep the long-term outlook uncertain. The next phase hinges on whether commercial execution and regulatory wins can translate to durable profitability.
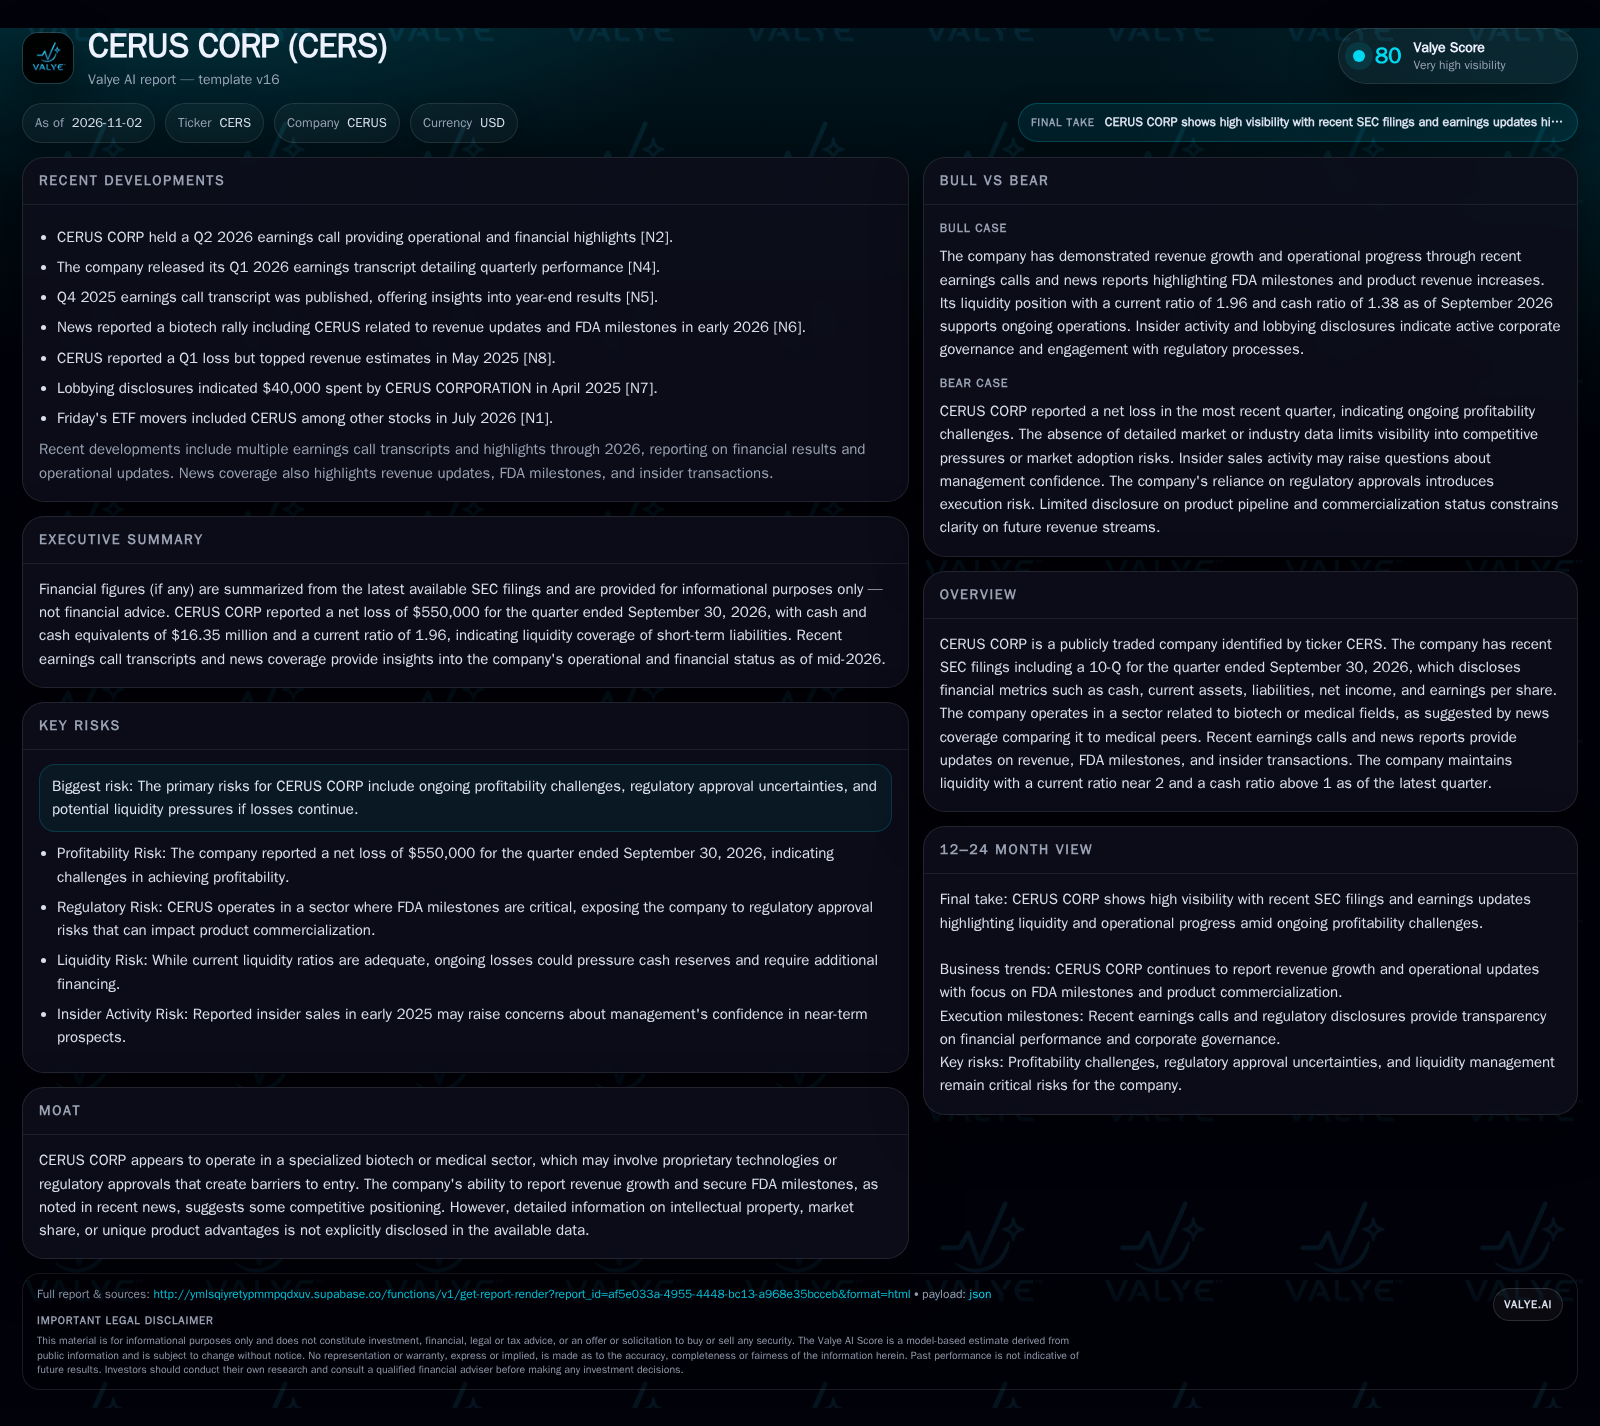
Cerus Corp (CERS) maintains a near-2 current ratio and continues to achieve FDA milestones and revenue growth, as highlighted in recent earnings calls and filings. However, the company reported a net loss of $550,000 in Q3 2026 and has not disclosed detailed pipeline or commercialization progress, leaving its path to sustainable profitability in question. The balance between ongoing operational progress, regulatory execution, and cash burn will determine whether Cerus can convert its specialty positioning into a defensible, profitable business model. [S2] [N2]
Recent earnings calls have touted FDA progress and revenue growth, yet the company’s ability to translate these into sustained profitability remains unproven. As Cerus navigates regulatory complexity and cash burn, the next chapters will be written by commercial execution and the durability of its competitive position. [S2] [N2]
Liquidity, Losses, and the Search for Commercial Momentum
As of September 30, 2026, Cerus Corp reported cash and cash equivalents of $16.35 million with current assets totaling $156.57 million against current liabilities of $80.01 million. However, Cerus posted a net loss of $550,000 for the quarter, with basic and diluted EPS at $0, underscoring persistent profitability challenges. Despite these losses, recent earnings calls have highlighted operational progress, including FDA milestones and revenue growth, but have not provided granular details on new product commercialization or adoption. [S2] [N2]
How Cerus’s Business Model Could Scale: Economics and Constraints
Cerus operates in a biotech/medical sector where revenue growth is typically driven by regulatory approvals, adoption of proprietary technologies, and expansion into new markets. The company’s historical revenue base ($51.3 million in 2017) suggests some degree of established commercial activity, likely centered around specialized medical devices or blood safety technologies. In such models, top-line growth is often a function of both pricing (premium for innovation or regulatory approval) and volume (adoption by hospitals, blood banks, or health systems).
Gross margins in this sector can be attractive if products are protected by intellectual property and regulatory barriers, but fixed R&D and regulatory costs are significant. Operating leverage should improve as sales scale, but ongoing net losses signal that Cerus has not yet achieved the necessary volume or pricing power to cover its fixed cost base. Capital needs remain a watchpoint: while the current ratio is nearly 2, persistent cash burn could force additional financing or strategic pivots if commercial traction does not accelerate.
Scaling Cerus's business model also depends heavily on the dynamics of reimbursement and pricing within its target markets. In medical device and biotech sectors, achieving favorable reimbursement codes and coverage policies can significantly enhance pricing power and adoption rates. However, reimbursement landscapes are often fragmented and subject to payer scrutiny, which can delay or limit market penetration. Additionally, the company's ability to demonstrate clear clinical and economic value to healthcare providers and payers will influence uptake velocity and volume expansion. If Cerus can secure reimbursement pathways that align with its pricing strategy, it would strengthen the business model's scalability and potentially improve gross margins through premium pricing.
Barriers, Substitution, and the Challenge of Differentiation in Blood Safety
Cerus’s sector—specialty biotech and medical devices—tends to feature substantial regulatory and technical barriers to entry. Proprietary technologies, regulatory approvals (notably FDA milestones), and clinical efficacy data are traditional sources of advantage. However, these are only durable if the company can maintain exclusivity, clinical relevance, and a clear route to reimbursement.
Competitive threats include both established medical device companies and emerging biotech firms pursuing similar blood safety or pathogen inactivation solutions. Substitution risk is elevated if new technologies offer greater efficacy, lower cost, or easier integration into clinical workflows. Without detailed disclosure on Cerus’s intellectual property position, contract structure, or customer retention, it is unclear whether the company enjoys meaningful switching costs or recurring revenue streams.
Another dimension influencing Cerus's competitive position is the potential for technological obsolescence or rapid innovation cycles in the blood safety space. Even with regulatory barriers, emerging scientific advancements or alternative pathogen inactivation methods could disrupt existing solutions. Therefore, Cerus's long-term defensibility may depend on continuous innovation, patent portfolio management, and the ability to adapt to evolving clinical standards. Furthermore, integration with hospital workflows and ease of use can be decisive factors in customer preference, as healthcare providers often prioritize solutions that minimize operational complexity. Without clear evidence of such competitive moats, the risk of substitution or margin compression remains a key strategic consideration.
If FDA Milestones Translate to Commercial Scale: The Bullish Chain of Events
A favorable scenario for Cerus would see recent and future FDA milestones catalyzing broader adoption of its products, driving step-function increases in revenues and gross margins. If the company can leverage its regulatory achievements to secure multi-year contracts with hospitals or blood centers, operating leverage could improve rapidly as fixed R&D and regulatory costs are absorbed across a larger revenue base.
This scenario would be confirmed by evidence of accelerating top-line growth, expansion into new geographies or indications, and explicit disclosure of multi-year customer commitments or recurring revenue contracts. Gross margin expansion and a shift to sustained profitability would further validate the thesis.
Gradual Commercial Uptake and Ongoing Cash Burn: The Middle Trajectory
The most plausible near-term path for Cerus is modest revenue growth tied to incremental FDA milestones and steady, but not explosive, product adoption. The company may continue to post small net losses as it invests in commercialization and regulatory activities, relying on its current liquidity to bridge the gap.
This base case would be confirmed by continued net losses (albeit narrowing), stable or slowly growing revenues, and periodic operational updates focused on regulatory progress rather than major commercial wins. Cash balances would gradually decline unless offset by new financing or a significant inflection in revenue.
When Regulatory Progress Fails to Deliver Profitable Growth
In a less favorable scenario, Cerus’s FDA milestones do not translate into meaningful commercial traction. Revenue growth could stall, and cash burn may accelerate as fixed costs remain high and new customer adoption lags expectations. This could force the company to seek dilutive capital raises or restructure its operations.
Evidence for this scenario would include flat or declining revenues, persistent or widening net losses, and reductions in cash balances without corresponding increases in commercialization activity. Additional warning signs would be management commentary focused on cost containment, pipeline delays, or increased reliance on external financing.
Milestones That Will Shape Cerus’s Profitability and Strategic Options
Quarterly revenue growth rates and the composition of revenue by product line or customer type, if disclosed.
Updates on new or renewed multi-year contracts with hospitals, blood banks, or health systems—especially if the structure implies recurring revenue.
Gross margin trends and commentary on cost of goods sold, indicating whether scale is improving unit economics.
Cash burn rate and the frequency/size of capital raises, which would signal the urgency of achieving commercial self-sufficiency.
Explicit disclosure of pipeline progress, product launches, or new regulatory milestones that could expand the addressable market.
Customer retention/churn rates and average contract duration, if disclosed, to test for stickiness and recurring revenue potential.
Any changes in insider activity or significant management departures that could indicate shifts in internal confidence or strategy.
Public or disclosed competitive wins/losses that clarify Cerus’s position relative to peers in the blood safety or biotech ecosystem.
Disclaimer: This is research-only, informational analysis and not investment advice. It may include AI-generated interpretation and general industry context. Always verify important details using primary sources.

Comments