
Carlyle Group Faces Q1 Earnings Pressure Despite Rising AUM
Carlyle reported a first-quarter earnings miss despite record assets under management growth, reflecting near-term performance headwinds amid market volatility.
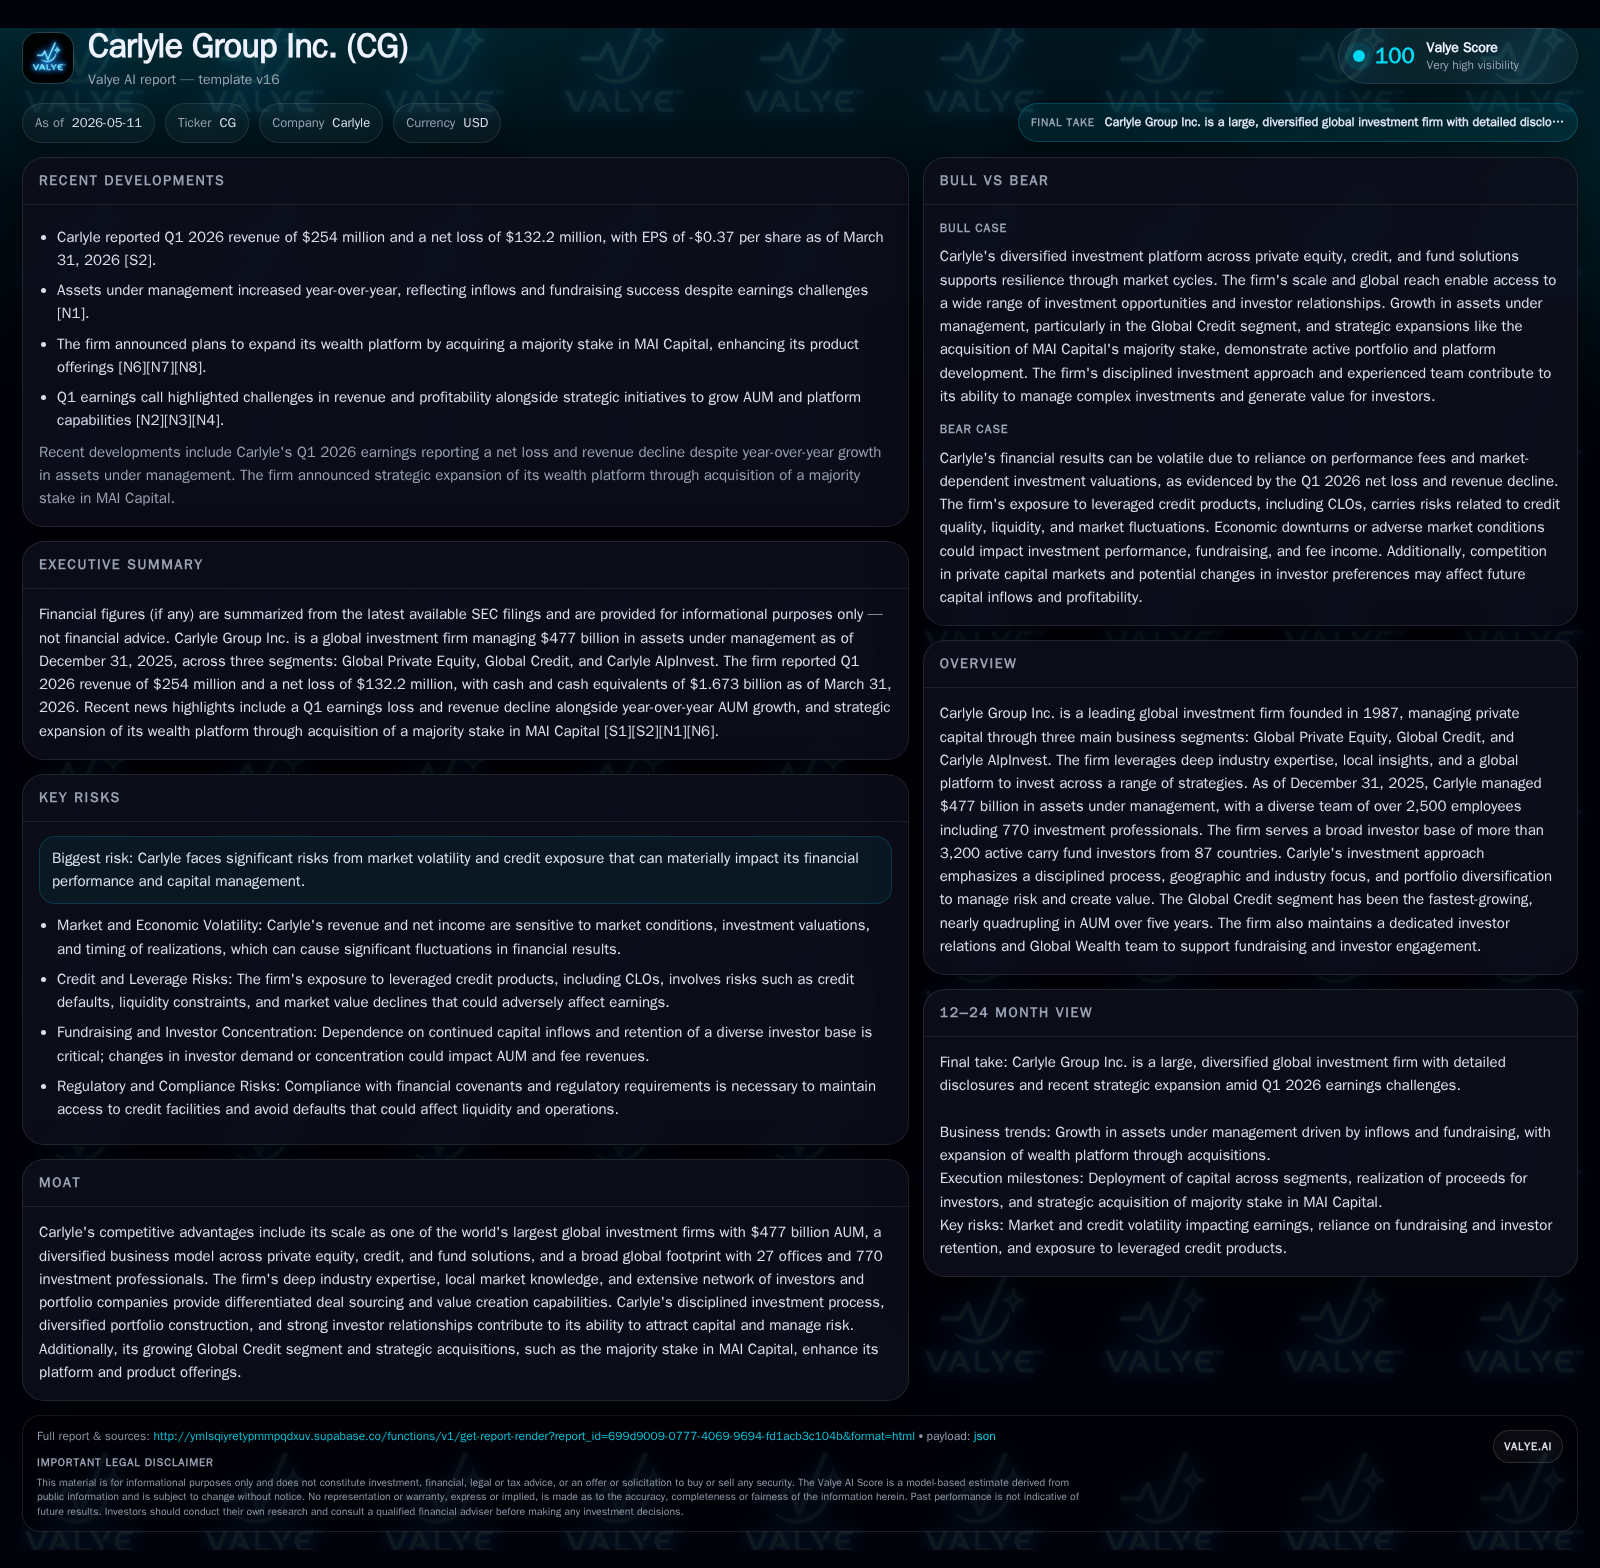
In Q1 2026, Carlyle Group's earnings fell short of expectations even as assets under management climbed to $477 billion year-end 2025. The divergence underscores the challenge of translating scale into immediate profitability amidst fluctuating investment income and performance fees. Carlyle’s expanding Global Credit segment continues to drive fundraising momentum, positioning the firm for long-term fee revenue growth, though short-term earnings face pressure from market volatility and credit risks.
Quarter 1 2026 Operating Update and Earnings Snapshot
Carlyle Group’s latest quarterly filing dated May 8, 2026 [S2] reveals a notable earnings setback contrasting with its expanding scale. Despite reporting assets under management (AUM) at $477 billion as of December 31, 2025—a robust 8% increase from the prior year—the group missed revenue and earnings expectations in Q1 2026. The company faced declining fee-related earnings driven by volatile net investment income alongside weaker performance fee realization. This divergence between top-line asset growth and near-term profitability pressures was highlighted in contemporaneous news reports detailing a sharp share price reaction [N1][N4].
The May 7 event filing [S3] supplemented this update by articulating how sustained market volatility disrupted expected performance allocations—a critical component of Carlyle’s incentive fee stream—and restrained transaction-related revenues. These dynamics underscored ongoing challenges in converting rising fund commitments into immediate earnings uplift. Moreover, the first quarter depicted net investment losses within consolidated funds that further weighed on reported results.
Carlyle’s Business Model and Product Segmentation
Carlyle operates through three primary business segments: Global Private Equity (GPE), Global Credit (GC), and Carlyle AlpInvest (formerly Global Investment Solutions) [S1]. Revenue comprises recurring management fees linked to AUM levels, incentive or performance fees triggered by fund investment gains, transaction fees from advisory activities, and returns from principal investments.
The firm's model capitalizes on deep sector expertise combined with geographic breadth—operating in 27 offices globally staffed by over 770 investment professionals—to source opportunities across industries. This scale generates economies in deal sourcing and portfolio operations that reinforce investor retention through embedded switching costs.
Within GPE, Carlyle focuses on buyouts, real estate investments, infrastructure, and life sciences sectors with significant fundraising success evidenced by recent flagship funds such as CAP VI (Asia buyout) and CRP X (U.S. real estate). Meanwhile, GC has been the star growth story with AUM nearly quadrupling over five years to $211 billion by end-2025—anchored by direct lending, structured credit, and CLO issuance capabilities that deliver stable fee revenue streams.
Carlyle AlpInvest complements these segments offering secondary fund solutions and customized portfolio finance services. This diversified segmentation cushions the firm against cyclical swings inherent in each strategy.
Competitive Positioning and Industry Dynamics
Standing among elite global alternative asset managers, Carlyle’s competitive moat stems largely from its sheer scale paired with specialization breadth. Its sizeable network of investors—over 3,200 active carry fund investors worldwide—creates durable capital-raising advantages amid an intensifying landscape featuring rivals like Blackstone, KKR, Apollo Global, and others.
The industry context highlights heightened competition for high-quality deal flow particularly in private equity amid tightening valuations. Regulation continues to evolve around disclosures and capital requirements impacting fund structures across regions.
Carlyle’s extensive reach enables differentiated deal origination paired with hands-on portfolio company value creation resources—augmenting long-term investment returns which form the basis for lucrative incentive fees. The firm's strategic strides into credit markets via direct lending diversify revenue bases beyond traditional equity investing while weaving broader risk mitigation through diversified product mix.
Growth Drivers Elevating Global Credit and Fundraising Success
Fundraising momentum is a notable driver underpinning Carlyle’s growth outlook. According to the latest filings [S1] complemented by industry news of recent strategic moves [N6][N7][N8], inflows reached $53.7 billion during fiscal 2025—a striking increase fueled primarily by $28.3 billion into GC strategies alone.
The structured credit platform led new issuance activity with 39 CLOs closed in 2025 including nine fresh deals—an operation scale that provides recurring portfolio advisory fees in addition to financing spread capture. Direct lending originations accelerated aggressively past prior years’ levels supported by middle-market focus where demand outpaces traditional syndicated loan availability.
Flagship fund closes such as CAP VI in Asia underline geographic diversification fueling cross-regional expansion while acquisitions like MAI Capital enhance wealth management distribution channels broadening access to affluent investor pools.
These quantifiable KPIs demonstrate scalable fundraising effectiveness with positive implications for future fee-related earnings growth as invested capital compounds over multi-year hold periods.
Risks, Challenges, and Constraints in Current Market Environment
Market volatility looms as a chief risk factor impacting valuation levels across portfolio holdings which directly influences accrued performance revenues—naturally volatile quarter-to-quarter given timing discrepancies between investment accruals and realizations [S1][S11]. Bloomberg-equivalent indices experienced concentration risk with heavy weighting on few technology names creating susceptibility to episodic shocks.
Credit exposure expands alongside the GC segment’s growth trajectory introducing potential default risks or impairment if economic slowdowns unfold unpredictably. Geopolitical fragilities notably surrounding Asian supply chains impose additional uncertainty particularly for funds concentrated or interconnected through tech hardware components production reliant on Taiwan Straits stability.
Regulatory headwinds remain as legislators globally recalibrate frameworks governing alternative asset managers' transparency requirements potentially altering fee structures or capital adequacy norms. Such regulatory flux may intermittently restrain capital raising speed or alter investor willingness.
Operationally, maintaining disciplined expense management alongside talent retention within an intensely competitive hiring market represents an ongoing constraint requiring persistent attention.
Future Milestones and What to Monitor Next
Looking ahead, near-term monitoring should emphasize fundraising cadence for marquee funds spanning private equity real estate initiatives to credit vehicles hosting CLO issuance pipelines. Investor reception metrics during these campaigns will reveal market appetite intensity post-Q1 volatility [N2][S3].
Additionally, tracking net realizations from matured portfolio companies offers insight into forthcoming incentive fee recognition cycles critical for bottom-line inflections.
Integration progress of MAI Capital holds strategic importance measuring how effectively Carlyle leverages this acquisition to bolster its wealth platform distribution enhancing cross-selling opportunities across product verticals.
Any shifts or comments emerging from upcoming earnings calls that recalibrate guidance expectations will be valuable gauges of execution momentum amid evolving macroeconomic conditions.
Concise Financial Summary Reflecting Current Liquidity and Capital Structure
As of March 31, 2026 end-of-quarter balance sheet data indicates cash and cash equivalents of $1.67 billion [F1]. Total debt and net debt figures are based on prior disclosures as of December 31, 2023, with total debt approximately $6.52 billion and net debt near $4.85 billion after adjusting for cash holdings [F1].
This capital structure supports operational flexibility although leverage levels require vigilant monitoring given interest rate environment shifts affecting funding costs [S1]. Dividend payments totaling $505 million alongside share repurchases worth $400 million during fiscal year 2025 highlight disciplined capital return policies aligned with shareholder interests without compromising balance-sheet strength.
This analysis focuses solely on operational insights derived from public filings without any form of investment recommendation or advice.
Disclaimer: This is research-only, informational analysis and not investment advice. It may include AI-generated interpretation and general industry context. Always verify important details using primary sources.
Comments