
Churchill Downs Inc Expands Gaming Footprint While Managing Margin Pressure and Leverage
The company is growing via new venue openings and acquisitions yet faces operating income pressure and substantial debt maturities.
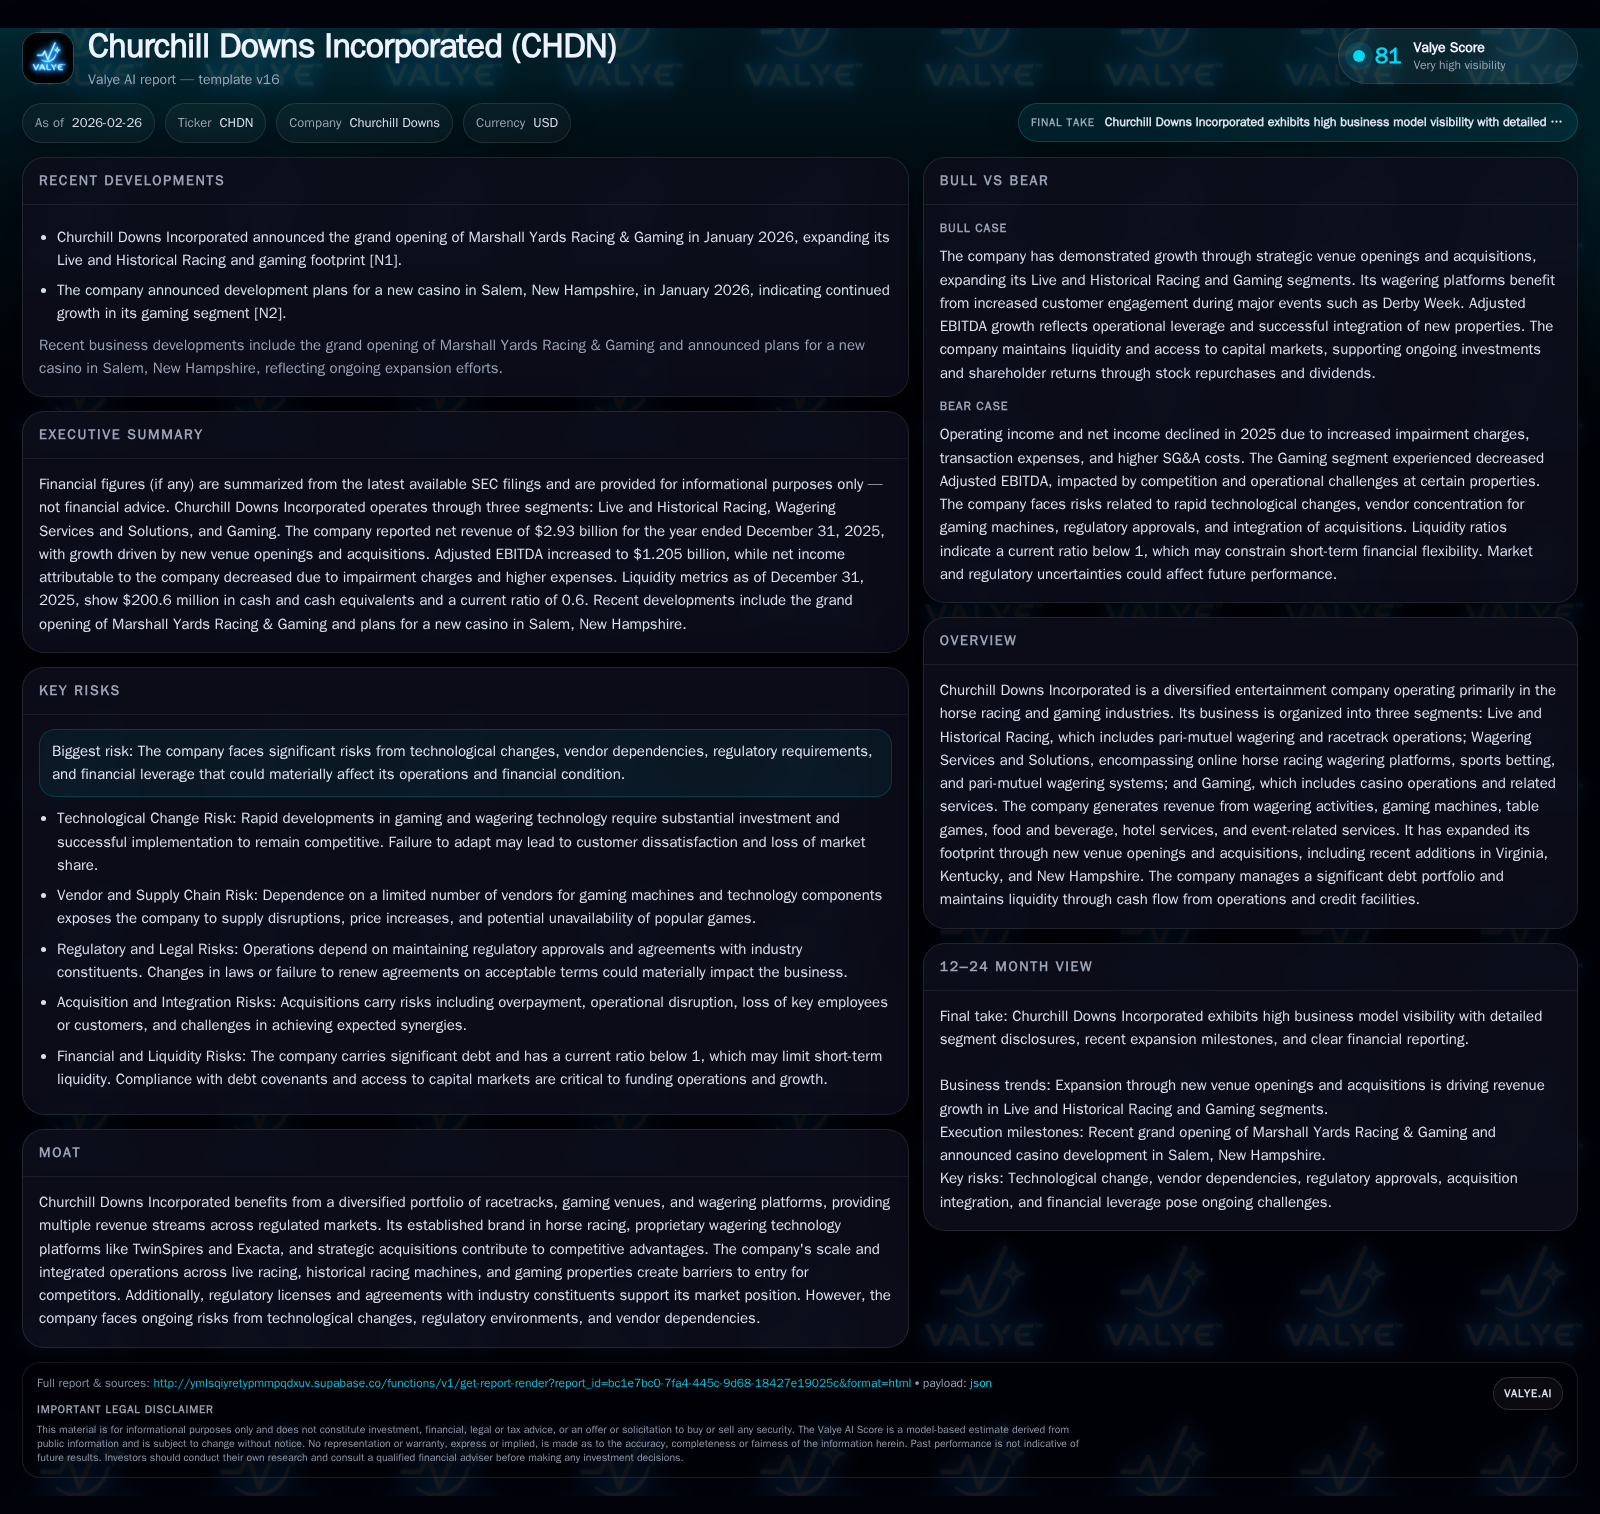
Churchill Downs Incorporated delivered over 13% revenue growth in 2025, driven by expansion in Live and Historical Racing and Gaming segments through new venue launches and strategic acquisitions. Operating income declined modestly due to impairment charges and higher expenses. The firm maintains a robust dividend policy with steady increases but carries significant debt with large maturities through 2030. An active stock repurchase program supports capital returns alongside investments focused on portfolio enhancements. Regulatory shifts, technological risks, and economic sensitivity remain key challenges.
Company Overview
Churchill Downs Incorporated (CHDN) operates as a diversified entertainment company focused on horse racing and gaming industries. Its core segments include Live and Historical Racing (pari-mutuel wagering and racetrack operations), Wagering Services and Solutions (online wagering platforms such as TwinSpires and Exacta), and Gaming (casino operations). Revenue sources encompass wagering activities, gaming machines, table games, food & beverage services, hospitality, and events.
The company pursues growth through new venue openings like Marshall Yards Racing & Gaming (opened Q1 2026) and announced plans for a casino in Salem, New Hampshire (early 2026) [N1][N2]. Acquisitions such as Casino Salem have expanded its regional presence.
Historical Performance
Churchill Downs has experienced strong revenue growth over recent years — from pandemic-impacted levels below $300 million in 2020 to nearly $2.93 billion by the end of 2025 [F1]. This reflects expansion into regulated gaming markets alongside digital wagering platform development.
Operating income rose markedly from $321.8 million in 2022 to $683.8 million in 2025 but declined slightly year-over-year due to a $43.6 million impairment related to Chasers' gaming rights plus increased SG&A and transaction expenses associated with new openings [S1][F1].
Net income decreased roughly 10% from $426.8 million in 2024 to $383 million in 2025 impacted by after-tax impairments, higher interest expense linked to increased debt balances, and valuation allowances on deferred tax assets [S1][F1]. Adjusted EBITDA grew by approximately $46.1 million indicating solid operational cash flow.
Historical performance (annual)
| FY | Net ($mm) | OpInc ($mm) | Net YoY |
|---|---|---|---|
| 2025 | 383 | 684 | -10.3% |
| 2024 | 427 | 709 | +2.3% |
| 2023 | 417 | 564 | -5.0% |
| 2022 | 439 | 322 |
Source: SEC companyfacts cache [F1].
Capital returns and efficiency (annual)
| FY | Div ($mm) | Buybacks ($mm) | ROE% |
|---|---|---|---|
| 2025 | 31 | 428 | 37.9 |
| 2024 | 29 | 186 | 39.4 |
| 2023 | 27 | 56 | 46.7 |
| 2022 | 26 | 175 |
Source: SEC companyfacts cache [F1].
Operating cash flow is approximated from SEC filings; capex includes project-related investments primarily targeting expansions such as Roseshire and Marshall Yards.
Growth Drivers and Challenges
Growth Catalysts:
- New Venues: Openings like Marshall Yards Racing & Gaming (Q1 '26), Owensboro (Feb '25), Roseshire (Sept '25), The Rose (Nov '24) contribute incremental revenues.
- Acquisitions: Purchases including Casino Salem expand revenue base with cross-selling potential.
- Digital Wagering Growth: Increased online betting during major events supports Wagering Services segment expansion.
- Regulatory Entry: Expansion into Virginia, New Hampshire markets adds new regulated gambling revenue streams.
- Integrated Operations: Synergies across racing, HRMs, casinos, hospitality improve margin potential over time.
Constraints:
- Asset Impairments: Significant write-downs dampen profitability metrics.
- Elevated Costs: Higher SG&A expenses driven by transaction costs related to acquisitions/openings reduce leverage.
- Economic Sensitivity: Consumer discretionary spending fluctuations impact wagering volumes.
- Technology Risks: Dependence on proprietary platforms introduces vulnerability to innovation pace or vendor issues.
- Regulatory Environment: Changing state laws may restrict market access or increase costs.
- Leverage & Refinancing Risks: Over $5 billion debt with large maturities approaching increases refinancing reliance amid variable credit conditions.
Capital Structure & Liquidity Position
As of December 31, 2025, total debt was approximately $5.16 billion comprising Term Loan A ($1.11 billion due ’29), Term Loan B-1 (~$286 million due ’28), revolver borrowings ($657 million), plus senior notes maturing between ’27–’31 totaling about $3.1 billion collectively [F1]. Revolving credit facility availability was about $535 million net of letters of credit providing liquidity flexibility.
The company met all covenants with:
- Interest coverage ratio at a strong 3.9x versus minimum required >2.5x;
- Secured net leverage ratio at approximately 1.4x versus maximum allowed <4x [S6][S10].
Capital expenditures totaled roughly $205 million in FY25 focused on ongoing projects at key properties; guidance for FY26 anticipates spend between $180–220 million subject to timing uncertainties [S9].
Dividend payments increased about 7% reaching an annualized $0.438 per share marking the fifteenth consecutive year of increases consistent with shareholder return discipline [S12]. Concurrently, share repurchases totaled nearly $428 million during FY25 under active buyback programs with about $429 million remaining authority at year-end for future purchases [S9][S20].
Operating cash flow remained near prior-year levels around $770 million despite reduced capex supporting estimated free cash flow near $112 million after capital investments [F1][S18]. This cash generation supports debt service, dividends, repurchases, and reinvestment.
Outlook & Milestones To Monitor
While explicit forward guidance beyond capex range is not provided, key factors include:
- Ramp-up success of recently opened properties like Marshall Yards impacting Live Racing revenues;
- Progress on Salem NH casino development amid regulatory approvals;
- Growth execution on digital wagering platforms during flagship racing events;
- Debt management addressing large bond maturities starting in ’27 via refinancing or capital markets access;
- Margin trends balancing acquisition-related costs against scale benefits;
- Regulatory developments potentially affecting licensing or taxation impacting profitability;
- Operational resilience amid consumer discretionary spending volatility.
Strategic Position & Risks
Churchill Downs benefits from a strong brand entrenched within horse racing culture complemented by proprietary wagering platforms TwinSpires and Exacta offering differentiated digital experiences creating competitive barriers . Geographic diversification through recent expansions reduces single-state exposure while integrated venue ecosystems provide cross-selling opportunities enhancing competitive positioning.
Risks persist including reliance on third-party vendors for critical software infrastructure risking service interruptions; evolving gambling regulations that could alter tax or operational frameworks; high fixed costs limiting margin flexibility; potential attendance disruptions from weather or health crises; intense regional competition; plus financial risks posed by elevated leverage increasing vulnerability should credit conditions tighten or earnings soften forcing capital constraints potentially curbing growth or returns [S29].
Conclusion
Churchill Downs enters a phase marked by ambitious physical expansion coupled with digital platform growth driving double-digit revenue momentum despite slight profitability pressures from impairments and transitional expenses tied to acquisitions/new openings. Disciplined capital allocation highlighted by rising dividends alongside robust share repurchases underscores management confidence even as significant debt maturities loom requiring prudent refinancing amidst volatile markets.
Management must balance growth investments with margin recovery while managing risks from technology shifts, regulation changes, economic sensitivities, and financial leverage ensuring sustainable shareholder value creation over medium-term horizons.
This analysis is based solely on publicly available information as of February 26, 2026 ([F1], [S#], [N#]). It does not constitute investment advice or a recommendation regarding securities.
Disclaimer: This is research-only, informational analysis and not investment advice. It may include AI-generated interpretation and general industry context. Always verify important details using primary sources.

Comments