
Chefs' Warehouse Expands Specialty Food Reach While Managing Margin and Leverage Dynamics
Recent quarterly results reflect strong organic growth and strategic acquisition with steady margin management amid inflationary pressures.
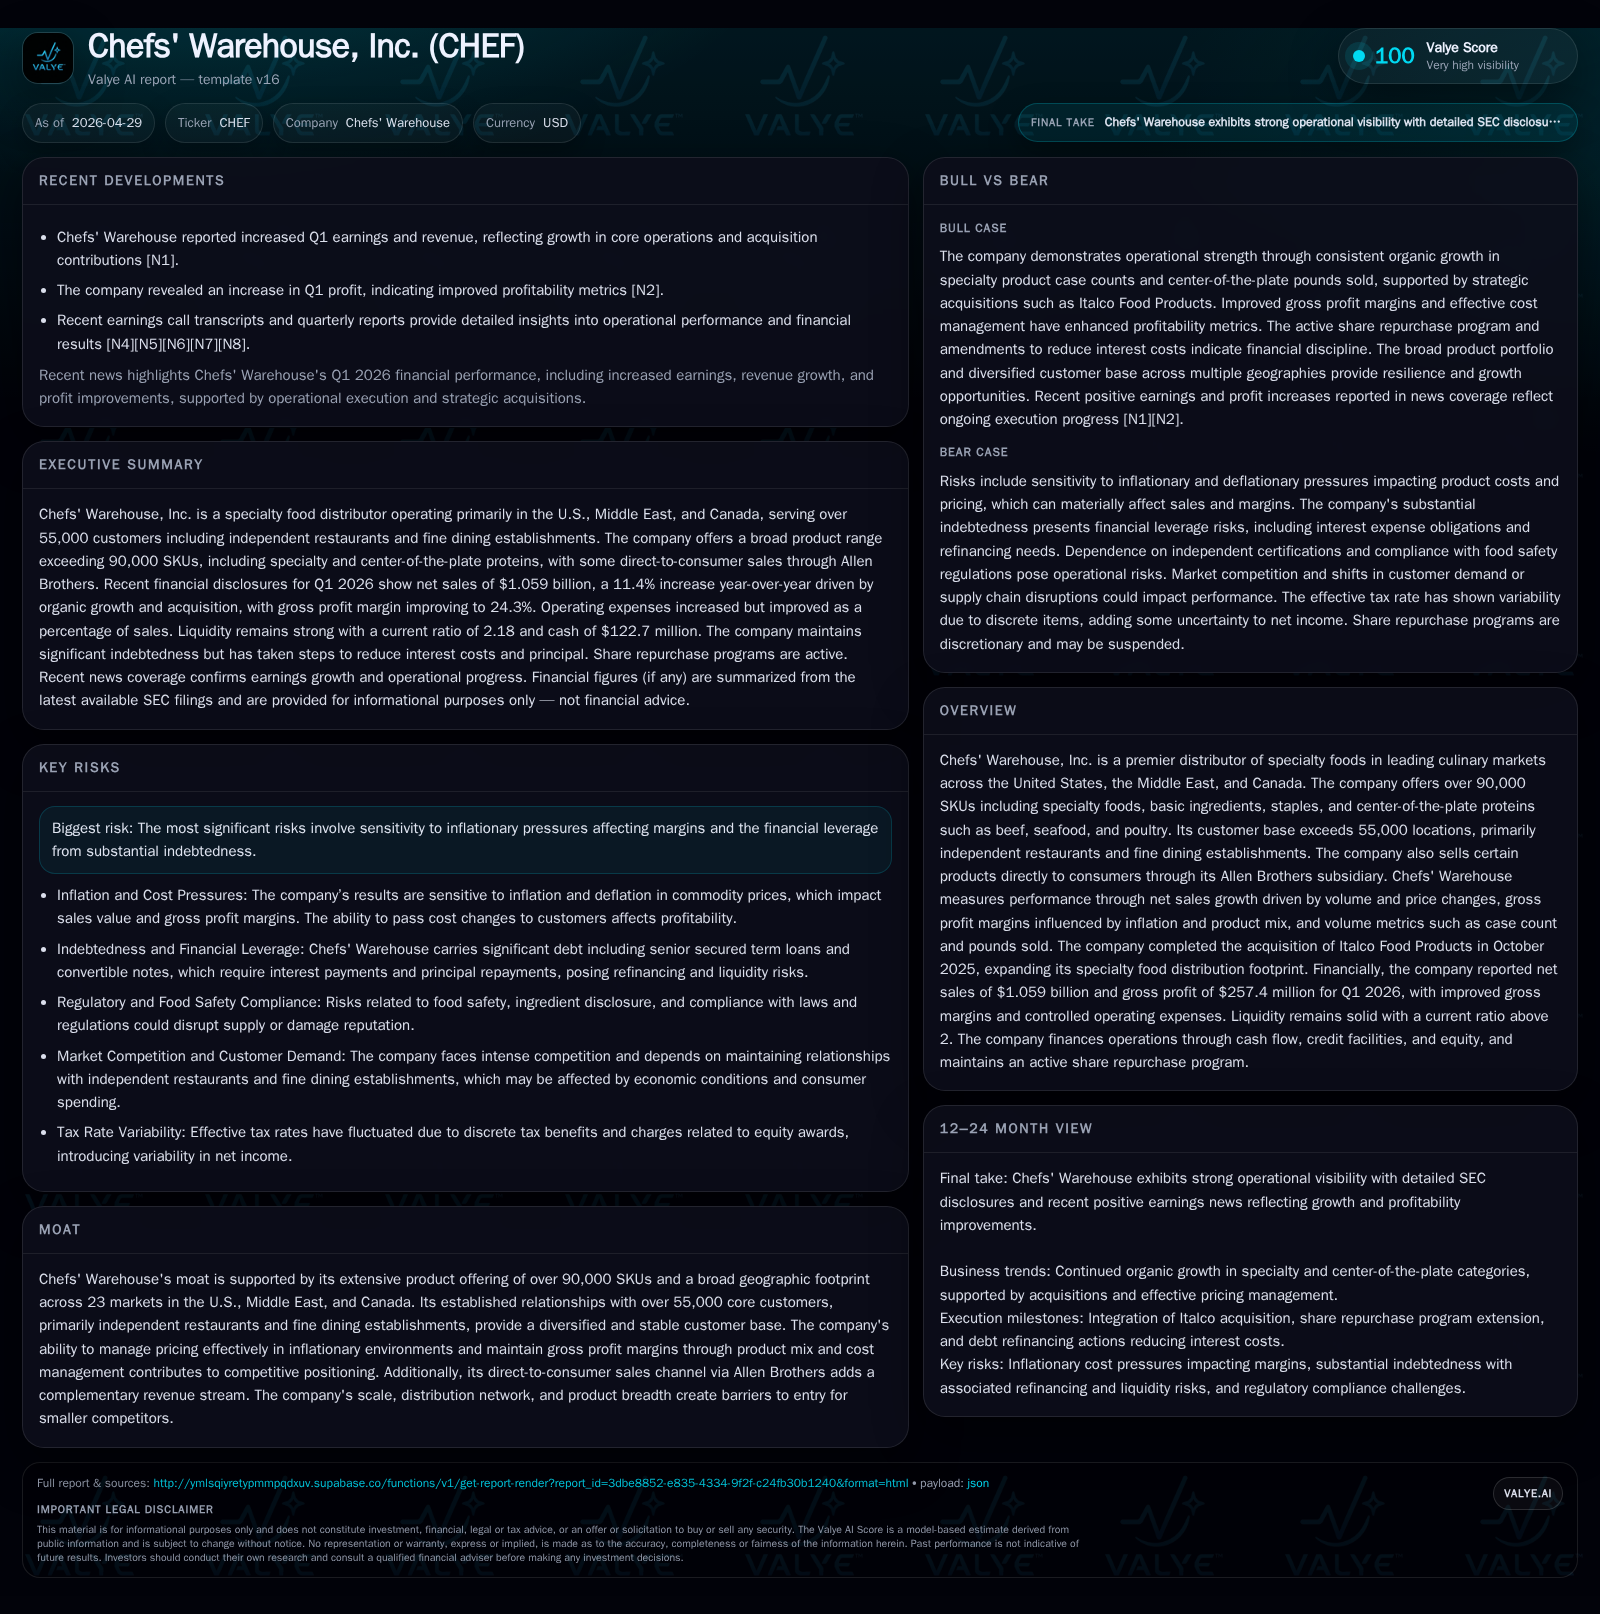
Chefs' Warehouse reported an 11.4% increase in net sales for Q1 2026, driven primarily by a 10.4% organic lift and the acquisition of Italco Food Products. The company's extensive specialty food portfolio and broad geographic footprint underpin its competitive moat, serving over 55,000 mainly independent restaurant customers across key culinary markets. While operating income and gross profit margins improved, gross margins remain sensitive to inflation and product mix shifts. Financial leverage is elevated but managed prudently through debt refinancings and share repurchases which continue to be part of capital allocation. Going forward, growth depends on expanding specialty product penetration, managing costs amid inflation, and integrating acquisitions like Italco effectively.
Recent Operating Update
Chefs' Warehouse's latest quarterly disclosure for the thirteen weeks ended March 27, 2026 reveals robust top-line momentum complemented by continued operational refinement [S2][S3]. Net sales jumped 11.4% year-over-year to $1.059 billion, substantially fueled by a strong organic uplift of $98.3 million (10.4%). The company's specialty product category notably expanded with a 5.7% increase in case count volume—an important structural metric reflecting physical growth rather than price effects—and positive customer metrics showing a 1.9% rise in unique customers alongside a 6.2% lift in SKU placements per customer [S2][S21]. Non-organic contributions included $10 million from the strategic acquisition of Italco Food Products completed in October 2025, underscoring management's intent to broaden its specialty food distribution reach into more regional markets.
Gross profit advanced sharply to $257 million (up approximately 14%), maintaining a consistent gross margin around the mid-24% range [S2]. This improvement reflects both higher volume and some favorable inventory management practices that helped offset persistent inflationary headwinds on commodity and ingredient costs—a recurring challenge given the company's high exposure to food inflation passing through its pricing models [S25]. Operating income also benefited, moving up to $33.1 million supported by scale efficiencies and cost controls amidst investments in logistics infrastructure and workforce [S21][S23]. Selling, general and administrative expenses grew but improved slightly as a percentage of sales owing to fixed-cost leverage.
The effective income tax rate rose from a low comparative base last year due mainly to fewer discrete credits attributable to stock award vesting benefits in this quarter; excluding those items the adjusted rate was about 30%, slightly above prior year's adjusted rate but within typical ranges for the company [S2][S23].
Liquidity remains robust with cash balances above $122 million and a strong current ratio over 2x, supportive of operational needs and strategic investments [F1][S2]. Total debt stands near $721 million but includes scheduled reductions; notably, the senior secured term loan facility was amended in January 2026 lowering interest spreads by half a percent followed by a voluntary $5 million principal prepayment [S7]. The company continues prudent financial stewardship including ongoing share repurchases funded via cash flow [S7].
Business Model Analysis
Chefs' Warehouse operates as a premier distributor specializing primarily in specialty foods alongside basic ingredients and center-of-the-plate proteins such as beef, seafood, and poultry across three continents: the United States, Middle East, and Canada [S1][S25]. Its business model depends heavily on breadth—offering more than 90,000 SKUs—and depth—serving more than 55,000 core customer locations predominately composed of independent restaurants and fine dining establishments which require high-quality diverse offerings often unavailable through conventional distributors.
Revenue mechanics hinge principally on volume increases (case counts for specialty products and pounds sold for center-of-the-plate items) augmented by price adjustments driven by commodity inflation or deflation effects plus evolving product mix favoring higher-margin specialty categories [S1][S25]. Pricing generally follows cost-plus or market-based methods enabling effective pass-through of inflationary pressures though timing mismatches can transiently compress margins.
The Allen Brothers consumer-facing subsidiary targeting direct-to-consumer high-quality protein sales adds incremental revenue diversification beyond wholesale restaurant channels without diluting focus.
This multi-product-channel approach enhances resilience against sector-specific shocks while fostering cross-category upselling synergy benefits highlighted during new product introductions or geographic expansions.
Industry Structure & Competitive Position
The food distribution industry is fragmented yet competitive—dominated regionally by multiple players focusing either broadly or on niche segments such as specialty or center-of-the-plate products. Chefs' Warehouse's moat derives from its expansive curated SKU offering combined with strong long-term relationships predominantly with independent chefs demanding uniqueness and quality over price alone thus reducing direct commoditized competition pressure [S1].
With operations covering 23 major geographic markets strategically distributed across high-density culinary hubs—paired with logistic investments enhancing delivery capabilities—the company maintains barriers against smaller rivals limited by capacity or scope.
Acquisitions like Italco exemplify targeted consolidation reinforcing regional dominance while tapping into adjacent customer bases without material overlap—a smart bolt-on growth tactic helping sustain unit economics via scale leveraging.
Growth Drivers
Growth is propelled primarily through:
- Organic Expansion: Increasing case counts (+5.7%), placements per customer (+6.2%), and attracting new unique customers (+1.9%) indicate structural gains rather than cyclical swings [S21]. These metrics underscore adoption strength in specialty products that typically command better margins.
- Product Mix Enhancements: Emphasis on specialty category penetration plus continuous new SKU introductions enable margin expansion via richer mix effects versus lower-margin center-of-the-plate commodities.
- Strategic Acquisitions: Recently closed Italco Food Products acquisition added incremental revenues ($10 million contribution) enhancing geographic footprint and customer base diversity while providing integration opportunities for cost synergies [S21][S12].
- Pricing Power: Inflation passing through cost-plus pricing methodologies alongside selective premiumization allow maintenance or slight improvement in gross margins despite volatile commodity markets.
- Direct Consumer Sales: Through Allen Brothers subsidiary focusing on premium proteins diversifies revenue streams supporting brand recognition beyond institutional customers.
Execution of these drivers rests on continued investments in supply chain efficiency, technology platforms enabling precise inventory management, and dedicated sales force expansions well versed in culinary trends.
Risks & Growth Constraints
Key risk considerations include:
- Inflation Sensitivity: Costs for raw materials remain volatile given global supply chain pressures; failure to fully offset input price hikes could erode gross margins significantly despite current pass-through mechanisms [S20].
- Leverage Load: A sizeable aggregate debt burden (~$721 million) implies exposure to rising interest rates or tightening credit conditions; although recent refinancing efforts reduce interest expense marginally, ongoing deleveraging is critical to preserve flexibility [F1][S7].
- Customer Concentration & Economic Cyclicality: Dependence on independent dining venues exposes revenues to discretionary spending cycles subject to macroeconomic swings potentially amplifying demand troughs.
- Integration Risks: M&A executions such as Italco carry customary uncertainties around cultural fit, operational integration costs,and realizing expected synergies promptly.
- Operational Complexity: Managing over 90,000 SKUs entails inventory risks including obsolescence or spoilage particularly within perishable refrigerated/frozen goods requiring sophisticated logistics.
- Regulatory Exposure: As food distributor engaging cross-border trade potentially faces evolving safety regulations,tariff fluctuations,and ESG compliance obligations impacting costs or operational parameters.
What To Watch Next
Going forward stakeholders should monitor:
- Quarterly updates on case count trends within specialty categories which signal true volume-led growth sustainability beyond price gains.
- Gross profit margin movements indicating how well inflationary challenges are managed versus pricing strategy effectiveness.
- Integration progress reports from Italco acquisition elucidating impact on operating income margins or working capital efficiency.
- Capital allocation cadence focusing on share repurchases versus debt reduction reflecting management’s confidence level balanced against financial risk appetite.
- Updates or shifts in geographic market penetration especially within newer markets such as the Middle East that present untapped opportunity potential.
- Guidance revisions on full-year net sales (initially forecasted between $4.35-$4.45 billion) and adjusted EBITDA expected between $276-$286 million per recent disclosures confirming growth trajectory assumptions [S29].
Financial Profile Brief Context
Latest financial snapshot
| Metric | Value | Period |
|---|---|---|
| Cash & equivalents | $123mm | |
| 2026-03-27 | ||
| Total debt | $721mm | |
| 2026-03-27 | ||
| Net debt | $598mm | |
| 2026-03-27 | ||
| Current assets | $931mm | |
| 2026-03-27 | ||
| Current liabilities | $428mm | |
| 2026-03-27 | ||
| Current ratio | 2.18x | |
| 2026-03-27 |
Source: SEC companyfacts cache [F1].
As of Q1 ending March 27, 2026, Chefs' Warehouse holds cash & equivalents of approximately $123 million against total debt near $721 million yielding net debt north of $598 million; however, working capital remains healthy at roughly $503 million resulting in a comfortable current ratio of about 2.18 indicating short-term liquidity preparedness [F1][S2]. Interest expense remained stable compared to prior year quarter though overall reductions were achieved across fiscal year through term loan amendments reducing spread by half a percentage point coupled with scheduled principal prepayments in January and Q1 [S7]. Operating cash flow generation moderated somewhat compared to prior year period due largely to timing of inventory purchasing but remains positive underpinning capital expenditure plans forecasted around $45-$55 million annually supporting supply chain investments [S2][S7].
Disclaimer: This is research-only, informational analysis and not investment advice. It may include AI-generated interpretation and general industry context. Always verify important details using primary sources.
Comments