
Clean Energy Fuels Corp’s Transformation: Balancing Expanding Infrastructure and Profitability Challenges
An exploration of how Clean Energy Fuels is growing its RNG infrastructure while confronting escalating operating losses and capital allocation complexities.
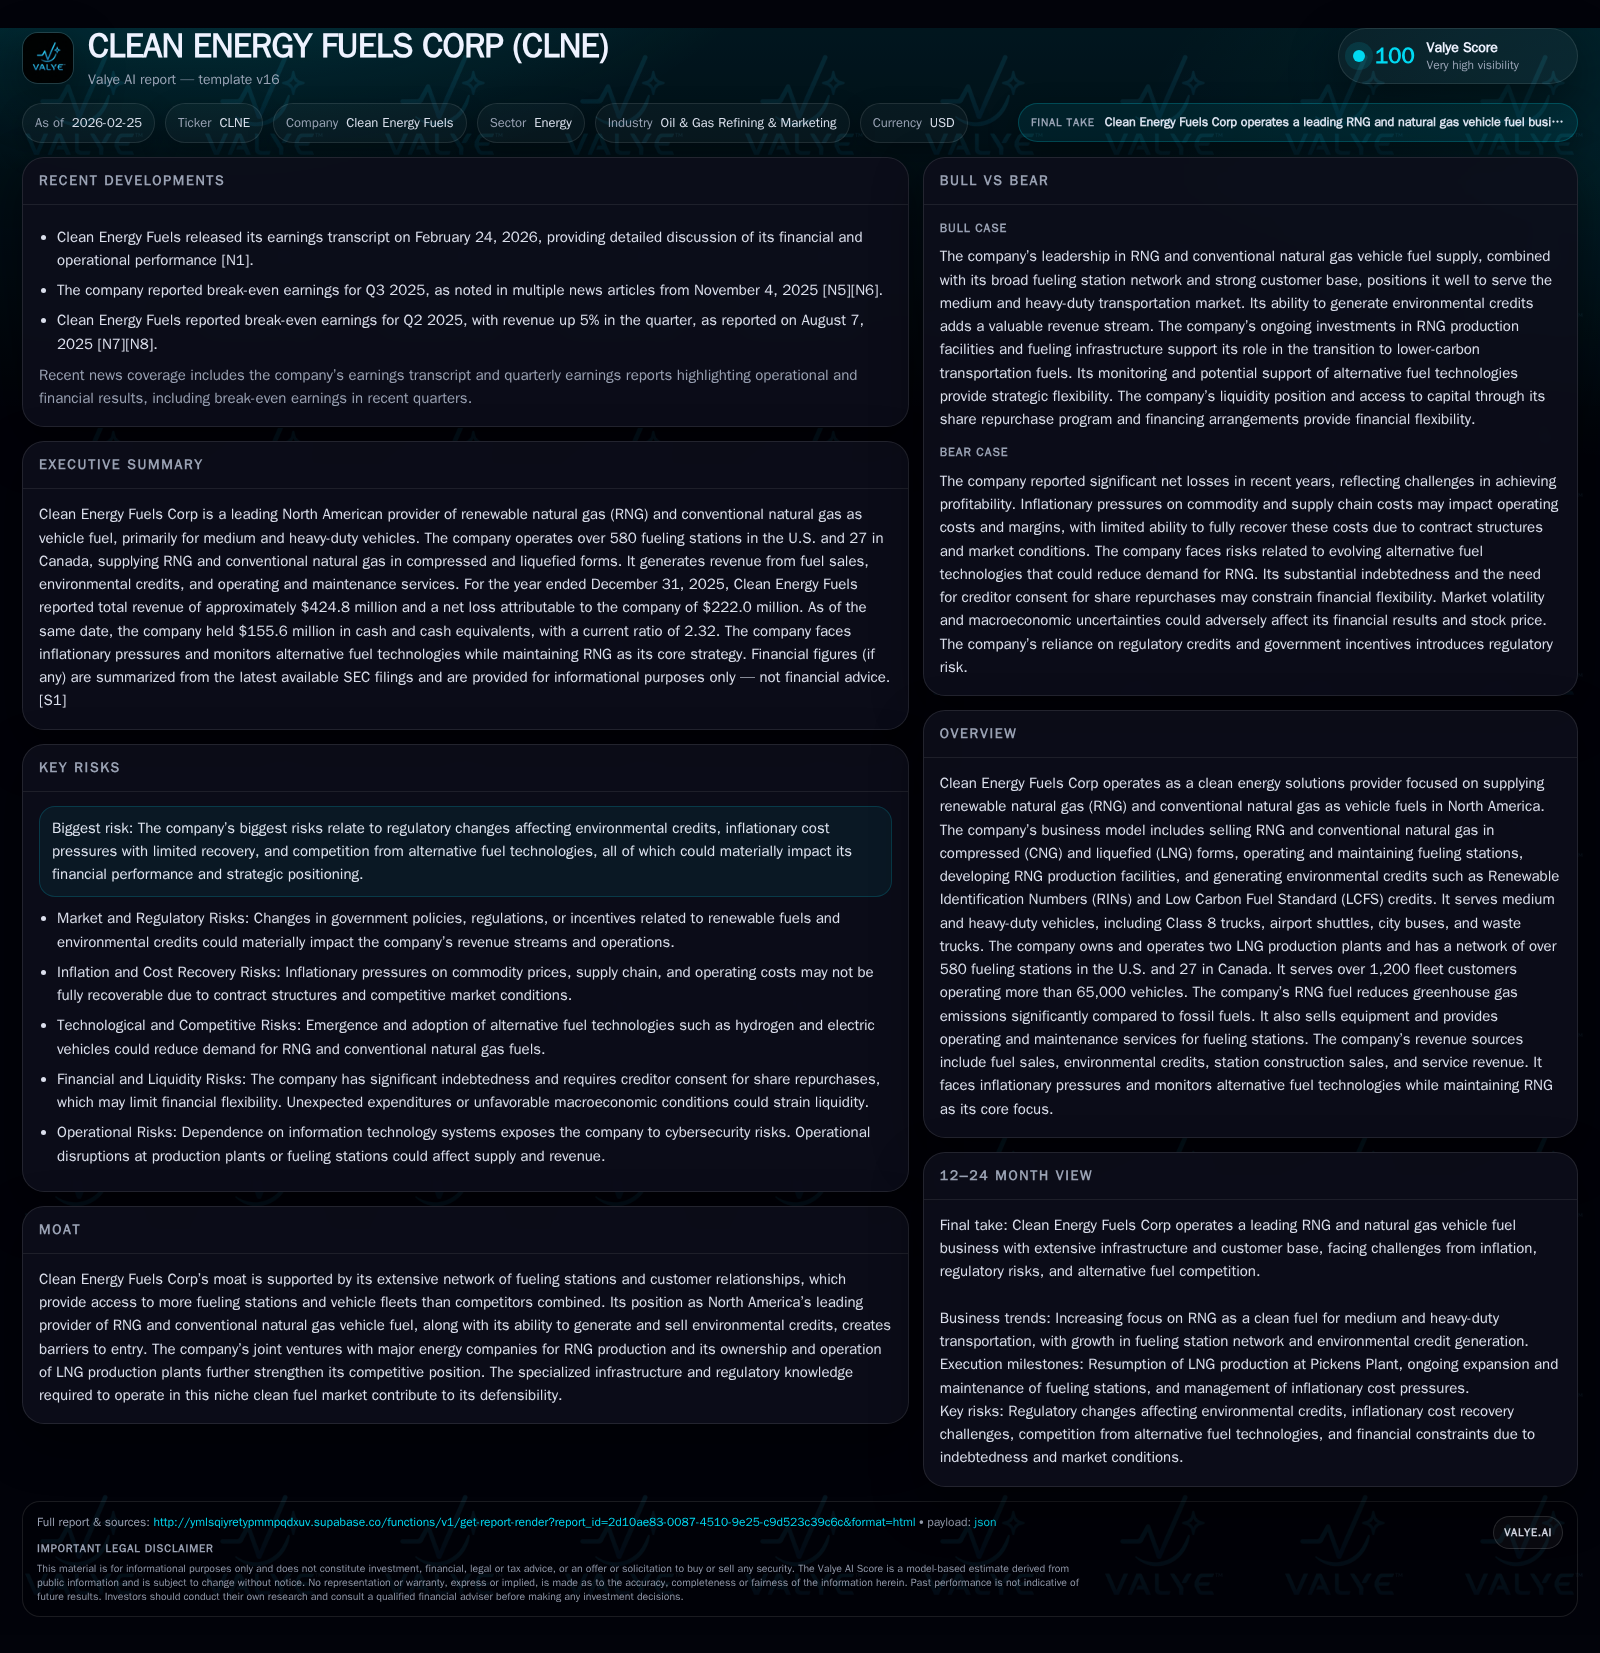
Clean Energy Fuels Corp (CLNE) has expanded its renewable natural gas (RNG) fueling network and fleet penetration significantly over recent years, leveraging a broad infrastructure of over 580 U.S. stations and 27 in Canada, serving over 65,000 vehicles. Despite this scale, the company’s financial performance has deteriorated sharply through 2025, marked by a net loss of $222 million and operating income decline of 340% year-over-year, driven by margin compression and operational challenges including major plant repairs at Pickens. Capital expenditures have been scaled back in response, focusing on prioritized RNG facility investments totaling an anticipated $42 million in 2026. With regulatory shifts affecting key environmental credit programs (RINs/LCFS) and inflationary cost pressures challenging pricing flexibility, Clean Energy Fuels walks a strategic tightrope balancing growth ambitions against profitability constraints.
Evolution of Fueling Network and Fleet Expansion: Historical Growth Drivers
Clean Energy Fuels Corp (CLNE) has anchored its growth strategy on expanding one of North America’s largest RNG fueling infrastructures. By December 31, 2025, CLNE operated or supplied approximately 582 fueling stations across the U.S. alongside 27 stations in Canada [S1][S18]. This extensive network supports over 65,000 medium- and heavy-duty vehicles, including Class 8 trucks, airport shuttles, city buses, and waste collection vehicles [S18]. The company’s model combines sales of renewable natural gas (RNG) and conventional natural gas in compressed (CNG) or liquefied (LNG) forms with operation & maintenance (O&M) services for many stations including those owned by customers.
This broad physical footprint coupled with established fleet relationships provides access to more fueling points than all competitors combined—a central moat underpinning the company’s market leadership [S18]. The vehicle sectors served have high fuel volume demand concentrated at centralized refueling sites or on designated routes, facilitating dedicated RNG adoption.
This scale contributed to CLNE's historical revenue levels near $340-$430 million between FY2014-FY2017; however, recent figures have contracted as shown below.
Operational Performance Deterioration and Financial Trends Through 2025
Historical performance (annual)
| FY | Net ($mm) | CFO ($mm) | OpInc ($mm) | Capex ($mm) | Net YoY |
|---|---|---|---|---|---|
| 2025 | -222 | 86 | -160 | 26 | -167.3% |
| 2024 | -83 | 65 | -36 | 65 | +16.5% |
| 2023 | -99 | 44 | -76 | 101 | -69.4% |
| 2022 | -59 | 67 | -52 | 45 |
Note: Omitted columns lack sufficient annual XBRL coverage in the provided tags (need ≥2 annual points): Rev, Div. Source: SEC companyfacts cache [F1].
Capital returns and efficiency (annual)
| FY | Buybacks ($mm) | FCF ($mm) | ROE% |
|---|---|---|---|
| 2025 | 8 | 60 | -39.7 |
| 2024 | 0 | -11.6 | |
| 2023 | 0 | -57 | -13.7 |
| 2022 | 6 | 22 | -8.2 |
Source: SEC companyfacts cache [F1].
*Partial or latest year data; revenue for FY2018 partial available [F1]
In FY2025 alone, CLNE posted a net loss of $222 million, more than doubling the net loss from FY2024 [$83 million], while operating income plummeted nearly 340% to -$160 million [F1]. Revenue declined about 15%, pressured by subdued product volumes amidst pricing compression.
Notably, operating cash flow improved by over 32%, reaching $85 million, suggesting enhanced working capital management despite worsening earnings [F1]. This divergence indicates significant non-cash charges impacting GAAP profits.
Operationally, the company completed major repairs at its Pickens LNG production plant that had been offline during much of 2023-24 for specialized equipment replacement; this resumption generated incremental revenue of $6 million for FY25 but also entailed capitalizing ~$2 million in repair costs [S1][S13]. Maintenance needs on specialized LNG infrastructure can disrupt fuel supply continuity temporarily while imposing high service costs.
Renewable Natural Gas Production Capacity: Strategic Investments and Milestones
CLNE considers expansion into RNG production critical for future growth and environmental credit generation potential [S18]. To date, it has invested approximately $365 million into anaerobic digester-generated RNG facilities across multiple joint ventures including partnerships with major energy players like BP [S4].
For FY2026 specifically, the company allocated about $42 million toward developing additional RNG facilities—focusing on dairy farm-based anaerobic digester (ADG) projects known for scalable methane capture [S4]. This builds upon prior JV contributions exceeding $280 million.
The Boron LNG plant—the cornerstone liquefaction asset—produces up to nearly 98.5 million gallons annually, with storage exceeding 1.8 million gallons capacity; utilization rates hovered just under 60% through FY2025 [S1], implying volume growth potential but also signaling possible throughput constraints or demand factors limiting full use.
Balancing sustained infrastructure investment with current operating losses marks a strategic crossroads: long-term positioning assumes RNG demand gains offset short-term profitability headwinds.
Revenue Pressure and Cost Dynamics: Understanding Recent Margin Compression
Margins have compressed sharply due mainly to inflation-driven cost increases combined with limited ability to raise prices commensurately given competitive pressures across fuel types [S25][S26][N1][N2]. Key margin headwinds include:
- Escalating commodity input costs not fully recoverable due to fixed-price contracts or competitive contract terms [S17]
- Volatility and regulatory uncertainty surrounding environmental credits such as Renewable Identification Numbers (RINs) and Low Carbon Fuel Standard (LCFS) credits which represent a material revenue component but experience fluctuating market prices driven by policy changes or energy market dynamics [S17][S29]
- Competition from emerging alternative clean fuels including electric battery vehicles and hydrogen deployments reducing bargaining power particularly in urban transit segments [N2][S12]
- Inflation impacts on supply chain logistics and specialized equipment sourcing—exemplified by extended downtime at Pickens during repair periods adversely impacting output consistency [S13]
These factors converge to tighten gross margins despite volume scale growth.
Capital Deployment Priorities: Capex, Debt Management, and Shareholder Returns
Facing macroeconomic pressures yet needing infrastructure funding, CLNE reprioritized capital allocation entering FY2025:
Capital expenditures were curtailed dramatically by over 60% year-over-year to approximately $25.7 million, down from nearly $65 million in FY2024—reflecting completed station buildouts and concentrated spending on selective RNG development projects planned at $42 million for FY2026 [F1][S4].
The company prepaid $65 million against its Stonepeak senior secured credit facility during FY2025 — reducing borrowings from about $315 million to around $250 million principal outstanding as year-end — demonstrating an emphasis on deleveraging within liquidity limits [S6][S9]. Interest obligations approximate $29 million annually at about a 9.5% coupon rate typical for leveraged private equity-led financing arrangements [S6][S9].
In shareholder returns avenues, share repurchases restarted modestly after inactivity during FY2024: CLNE repurchased roughly $7.9 million worth of shares across approximately 4.9 million shares during FY2025 under an authorized program capped at $50 million total buybacks—with creditor consents governing repurchase caps given loan covenants [F1][S8]. Dividends remain absent pending sustained path toward earnings normalization; dividend data is not available from provided tags.
Regulatory Environment Impacting Environmental Credits and Market Position
Monetization of federal Renewable Identification Numbers (RINs)—under the Renewable Fuel Standard—and state Low Carbon Fuel Standard (LCFS) credits remains pivotal yet increasingly uncertain [S12][S13][N2]. These credits underpin incremental economics beyond baseline fuel sales:
- Regulatory refinements can modify eligibility criteria or credit generation volumes,
- Credit pricing volatility exposes revenues to broader energy market swings,
- Compliance disputes involving interpretation or enforcement introduce risks of penalties or credit revocation,
- Inclusion/exclusion of competing low-carbon fuels affects relative value propositions.
These uncertainties pose tangible financial risks requiring robust compliance sophistication—a competitive moat sharpened by CLNE’s expertise but also a potential vulnerability if environmental policies pivot unfavorably.
Future Outlook: Constraints Affecting Growth Opportunities and Profitability
Looking ahead without new explicit guidance disclosed publicly yet [N2], CLNE faces critical constraints:
- Persistent inflationary input costs may continue pressuring margins absent contractual repricing flexibility,
- Expanding electric vehicle adoption rates threaten medium-and-long-term natural gas vehicle demand,
- Evolving regulatory frameworks may create opportunities via incentivization or impose limitations through stricter emission standards,
- Infrastructure scaling requires significant capital deployment balanced against improving operating leverage currently elusive,
- Environmental credit markets remain volatile with policy dependency intertwining economics tightly.
Management commentary hints at ongoing efforts to optimize operational efficiencies while progressing RNG project pipelines but acknowledges market unpredictability creating strategic tradeoffs between growth speed versus consolidated profitability [N2][S25].
Key Metrics to Monitor: Cash Flow Generation, Credit Market Developments, and Joint Venture Progress
For comprehensive monitoring of Clean Energy Fuels’ trajectory toward durable profitability amid growth ambitions:
- Operating cash flow: Trending positive despite losses signals capacity improvement;
- Capex efficiency: Effective deployment into RNG assets critical for long-term topline sustainability;
- Environmental credit pricing: Closely watch RIN/LCFS market conditions influencing revenue streams;
- Debt reduction strides: Refinancing or prepayments lessen interest burdens enhancing cash flow health;
- Joint venture milestones: Progress across ADG RNG facilities measures fulfillment of strategic pipeline;
- Fuel station utilization rates: Indicative of demand momentum translating infrastructure into sales volumes;
- Regulatory developments: Monitoring policy shifts essential for scenario planning around credit realization risks.
These indicators will collectively inform understanding whether CLNE can balance continued infrastructure investment with emerging profitability improvements over subsequent periods.
This analysis summarizes Clean Energy Fuels Corp's recent performance trends based exclusively on publicly filed SEC data ([F1],[S1]-[S29]) and contemporaneous news reports ([N1],[N2]). It refrains from speculative forecasts or investment recommendations per compliance requirements.
Disclaimer: This is research-only, informational analysis and not investment advice. It may include AI-generated interpretation and general industry context. Always verify important details using primary sources.
Comments