
CMB.TECH NV Advances Fleet Strategy as 2025 Results Show Resilience
The latest quarterly disclosures detail fleet utilization and chartering dynamics that underpin CMB.TECH’s operational adaptability amid evolving maritime market conditions.
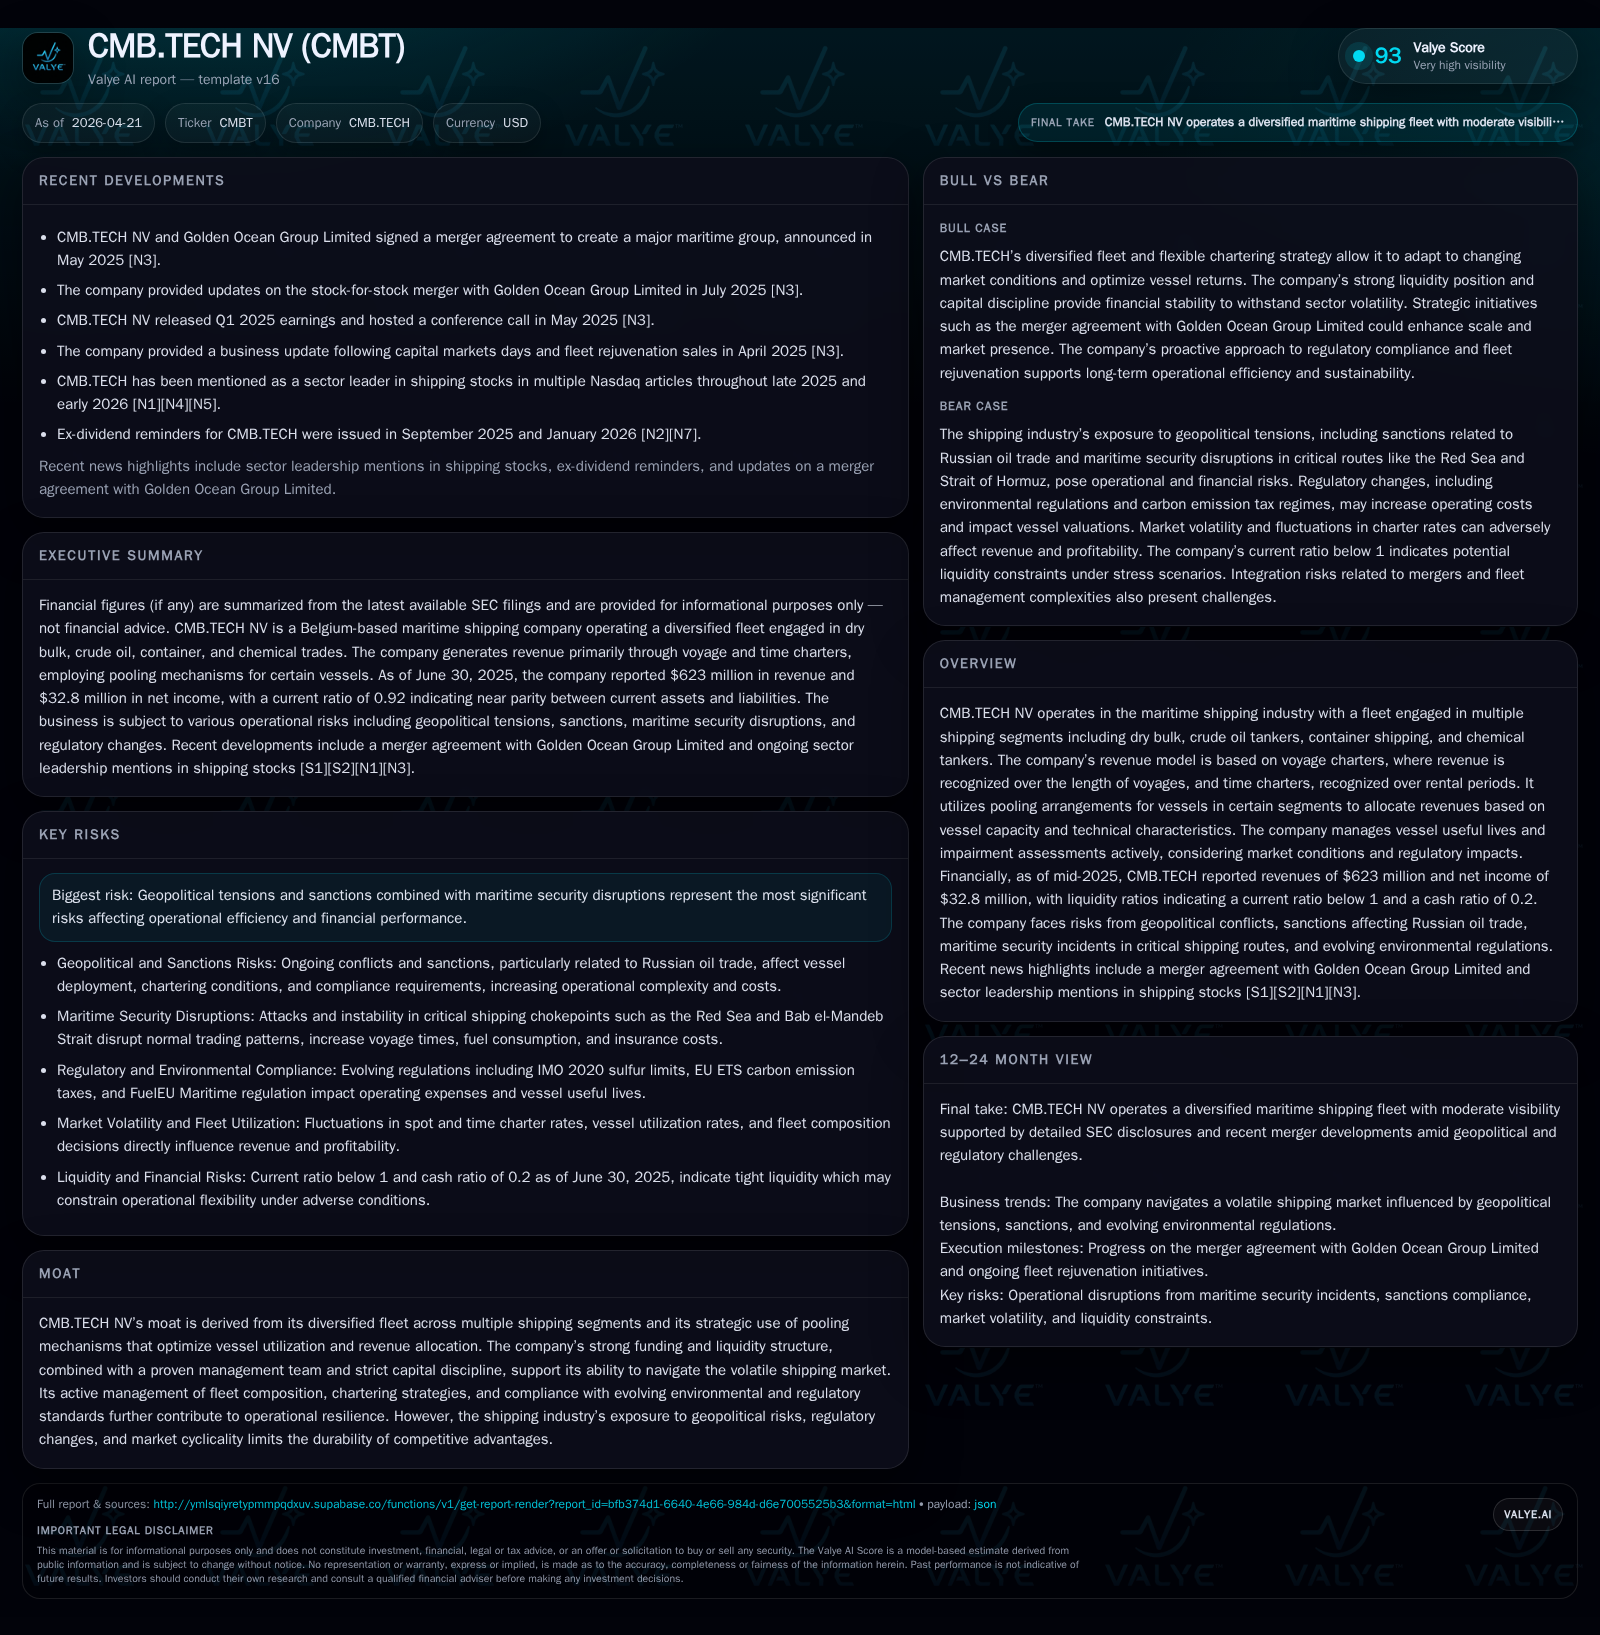
CMB.TECH NV reported its 2025 year-end financials and quarterly updates early in 2026, reflecting resilient operations across its diversified maritime fleet despite sector headwinds. The company’s business model leverages a mix of voyage and time charters enhanced by pooling arrangements across dry bulk, crude oil, container, and chemical tanker segments. Strategic fleet management and capital discipline have helped CMB.TECH maintain stable revenues amidst shifting freight patterns influenced by geopolitical tensions and regulatory pressures. Credit facilities with sustainability-linked terms further support operational flexibility. Going forward, the maturity of key credit lines and sanction-driven trade reconfigurations will be critical focus areas.
Latest Quarterly Performance Highlights
CMB.TECH NV’s most recent interim operating disclosure dated April 1, 2026 [S2] reiterates the company’s steady financial footing through the full-year 2025 period. The release accompanies reaffirmation of their multi-pronged charter strategy—balancing voyages executed under time charters with flexible spot market voyages according to market conditions. CFO Ludovic Saverys emphasizes the importance of vessel utilization optimization amid increasingly complex geopolitical disruptions impacting trade flows.
The company's deployment strategy involves dynamic allocation across dry bulk carriers, crude oil tankers (including Very Large Crude Carriers–VLCCs), container ships, and chemical tankers, applying pooling arrangements for certain subsets to allocate revenues corresponding to capacity (deadweight tonnage - dwt) and technical specifications. These pools enable CMB.TECH to capture aggregate market earnings efficiently while smoothing segment-specific volatility [S2,S3].
Recent operational commentary signals that despite enduring pressure on freight rates due to global oversupply of vessels (+3-4% year-on-year increases in dry bulk and container fleets), effective mix management between time charter equivalent (TCE) earnings from spot versus fixed contracts maintains revenue stability. The short-term revenue drivers reflect moderated spot freight rates but sustained contract coverage in core segments.
CMB.TECH’s Business Model and Revenue Streams
The company derives revenues principally from voyage charters where income is recognized over voyage completion—earning revenue days net of ballast (non-revenue repositioning) days—and from time charters producing steady monthly income regardless of spot rate fluctuations [S1]. This dual approach underpins operational flexibility; voyage charters enable upside in tight markets while time charters provide downside protection amid cyclical troughs.
Pooling arrangements particularly in the crude oil sector allow CMB.TECH to aggregate vessel capacities into common pools where revenues are shared pro-rata according to vessel capabilities rather than individual ship performance alone. This mitigates idiosyncratic risk across heterogeneous fleets given varying ship ages, fuel efficiencies, and technical specs.
Fleet composition actively evolves driven by vessel acquisitions or sales aligned with shifts in demand ton-miles—estimated increases for dry bulk (+1.8%) and chemicals (+0.8%) contrasted with slight declines in container demand (-1.1%) for 2026 [S1]. These nuanced ton-mile dynamics strongly influence ship utilization rates: supply side growth outpaces demand moderately in recent periods (dry bulk +3.4% dwt supply growth), constraining average TCE rates.
The company also manages vessel useful lives carefully through impairment assessments sensitive to steel prices, age-related depreciation schedules, and regulatory mandates such as the EU Ship Recycling Regulation which imposes end-of-life disposal costs that factor into long-term asset valuations [S1]. Implementing IMO 2020 sulfur emission caps necessitates retrofits or compliant fuel usage adding operational expenditure layers.
Competitive Position and Industry Dynamics
CMB.TECH’s competitive advantage rests on its diverse asset base spanning multiple maritime segments alongside strategic chartering flexibility—a structural moat supporting resilience across volatile macroeconomic cycles . Its participation in pooling enables engineering of optimized route deployment enhancing fleet utilization—key in an industry typified by oversupply pressures measured in million dwt terms.
The company also benefits from established financing relationships offering sustainability-linked credit terms incentivizing emissions reduction targets aligned with the Poseidon Principles . This financial innovation provides both lower borrowing costs upon achievement of KPI milestones and reputational alignment with ESG mandates increasingly valued by investors.
Nonetheless, exposure to geopolitical risks is material. Sanctions restricting access to Russian crude oil markets have diverted flows eastward towards Asia—lengthening voyage distances for tanker subsectors while introducing trade complexities tied to screening enforcement by charterers [S1]. Additionally, war-risk insurance premiums have increased alongside elevated security concerns around chokepoints like the Strait of Hormuz impacting bunker consumption profiles.
Industry cyclicality remains pronounced; capacity expansions driven by newbuild deliveries juxtaposed against episodic scrubber retrofitting impair short-term supply-demand balance. However, CMB.TECH's ability to modulate charter strategies between spot market earnings during upswings versus stable time charters mitigates the amplitude of these cycles.
Growth Opportunities and Constraints
Longer-term demand tailwinds derive primarily from incremental growth in dry bulk ton-miles tied to commodity movements such as iron ore and coal for steel production — usage that remains structurally linked to global industrialization trends [S1]. Chemical tanker demand sees moderate expansion from specialty cargo growth while container trade experiences mild headwinds due to economic recalibrations reducing unit volume growth slightly.
Fleet-level constraints relate chiefly to regulated slow steaming reducing average sailing speeds in an effort to meet carbon intensity targets (FuelEU Maritime), which effectively constrains available supply capacity although offering opportunities for rate improvement if demand remains robust.[S1]
Margin impacts reflect a deliberate tilt towards a balanced charter mix; increasing longer-duration time charters ensures revenue predictability despite foregoing premium spot-rate spikes during seasonal peaks. Furthermore, investments into greener vessels or retrofitting existing assets with scrubbers elevate capital expenditures but are essential for compliance with evolving IMO emissions thresholds.
Key Near-Term Watchpoints
Attention centers on the scheduled April 7, 2026 maturity of the €80 million unsecured revolving credit facility recently prepaid and terminated ahead of schedule [S4], indicating prudent liquidity management ahead of refinancing requirements.
Monitoring spot freight market signals—particularly VLCC rates influenced by sanction-driven tanker rerouting—and associated war-risk cost inflation remains critical given their outsized effect on profit volatility relative to container or chemical segments.
Execution around sustainability KPIs embedded in credit agreements will be telling for margin adjustments on borrowings as well as reputational positioning within ESG frameworks guiding capital market access.
Dividend policy pacing tied to covenant maintenance will also serve as a barometer for cash flow health given Belgian law restrictions demanding sufficient net asset backing before payout [S1].
Financial Summary and Capital Structure Analysis
Supporting this narrative is CMB.TECH’s financial profile showing overall top-line contraction yet resilient profitability metrics. Revenue declined approximately 23.9% year-over-year from $1.235 billion in FY 2023 to $940 million in FY 2024 [F1], largely reflective of softened freight levels but ameliorated by active chartering mix optimization.
Net income remained relatively flat at roughly $871 million USD for FY 2024 vs prior year ($858 million), driving a robust return on equity near 73%, evidencing disciplined cost control including bunker management and amortization policies [F1].
Liquidity balances remain solid with cash & equivalents at approximately $155 million as of mid-2025 juxtaposed against current liabilities pushing a slightly subunital current ratio near ~0.92 — consistent with asset-heavy capital structure norms in shipping [F1].
Indebtedness includes several sizable senior secured credit facilities totaling several billion USD spread across various tenors with embedded sustainability pricing mechanisms incentivizing continued emissions reductions (e.g., ~$161 million sustainability-linked loan maturing in 2030) [S4–S6,F1]. Loan covenants stipulate minimum equity ratios (30%), minimum cash balances (> $30m), current asset coverage requirements, plus restrictions on asset disposal or dividend declarations ensuring financial discipline under volatile market conditions [S11,S12].
Capital allocation demonstrates strategic prudence; we observe sizeable dividends paid ($1.11 billion USD FY2024) aligned with availability under strict local legal limits balancing shareholder returns against liquidity preservation [F1,S25]. Sale-and-leaseback transactions enhance balance sheet flexibility while preserving operational control over assets [S14–S16].
Historical performance (annual)
| FY | Rev ($mm) | Net ($mm) | Rev YoY | Net YoY |
|---|---|---|---|---|
| 2024 | 940 | 871 | -23.9% | +1.5% |
| 2023 | 1235 | 858 | +44.5% | +322.2% |
| 2022 | 855 | 203 | +103.6% | +160.0% |
| 2021 | 420 | -339 |
Source: SEC companyfacts cache [F1].
Capital returns and efficiency (annual)
| FY | Div ($mm) | ROE% |
|---|---|---|
| 2024 | 1111 | 73.0 |
| 2023 | 646 | 36.4 |
| 2022 | 24 | 9.4 |
| 2021 | 24 | -17.3 |
Source: SEC companyfacts cache [F1]. | In summary, CMB.TECH NV exhibits operational resilience anchored by its multi-segment fleet diversification complemented by prudent financial stewardship focused on navigating cyclical shipping volatility compounded by emergent geopolitical risks. Close monitoring of financing maturities alongside evolving market freight patterns connected to sanctioned energy trades will remain pivotal influencers shaping near-term prospects.
This report is for informational purposes only and does not constitute investment advice or recommendations.
Disclaimer: This is research-only, informational analysis and not investment advice. It may include AI-generated interpretation and general industry context. Always verify important details using primary sources.
Comments