
CME Group Strengthens Global Derivatives Leadership with Record Volume and Expanding Product Suite in 2025
Robust revenue growth and strategic initiatives underpin CME Group’s dominant position in global derivatives and clearing markets.
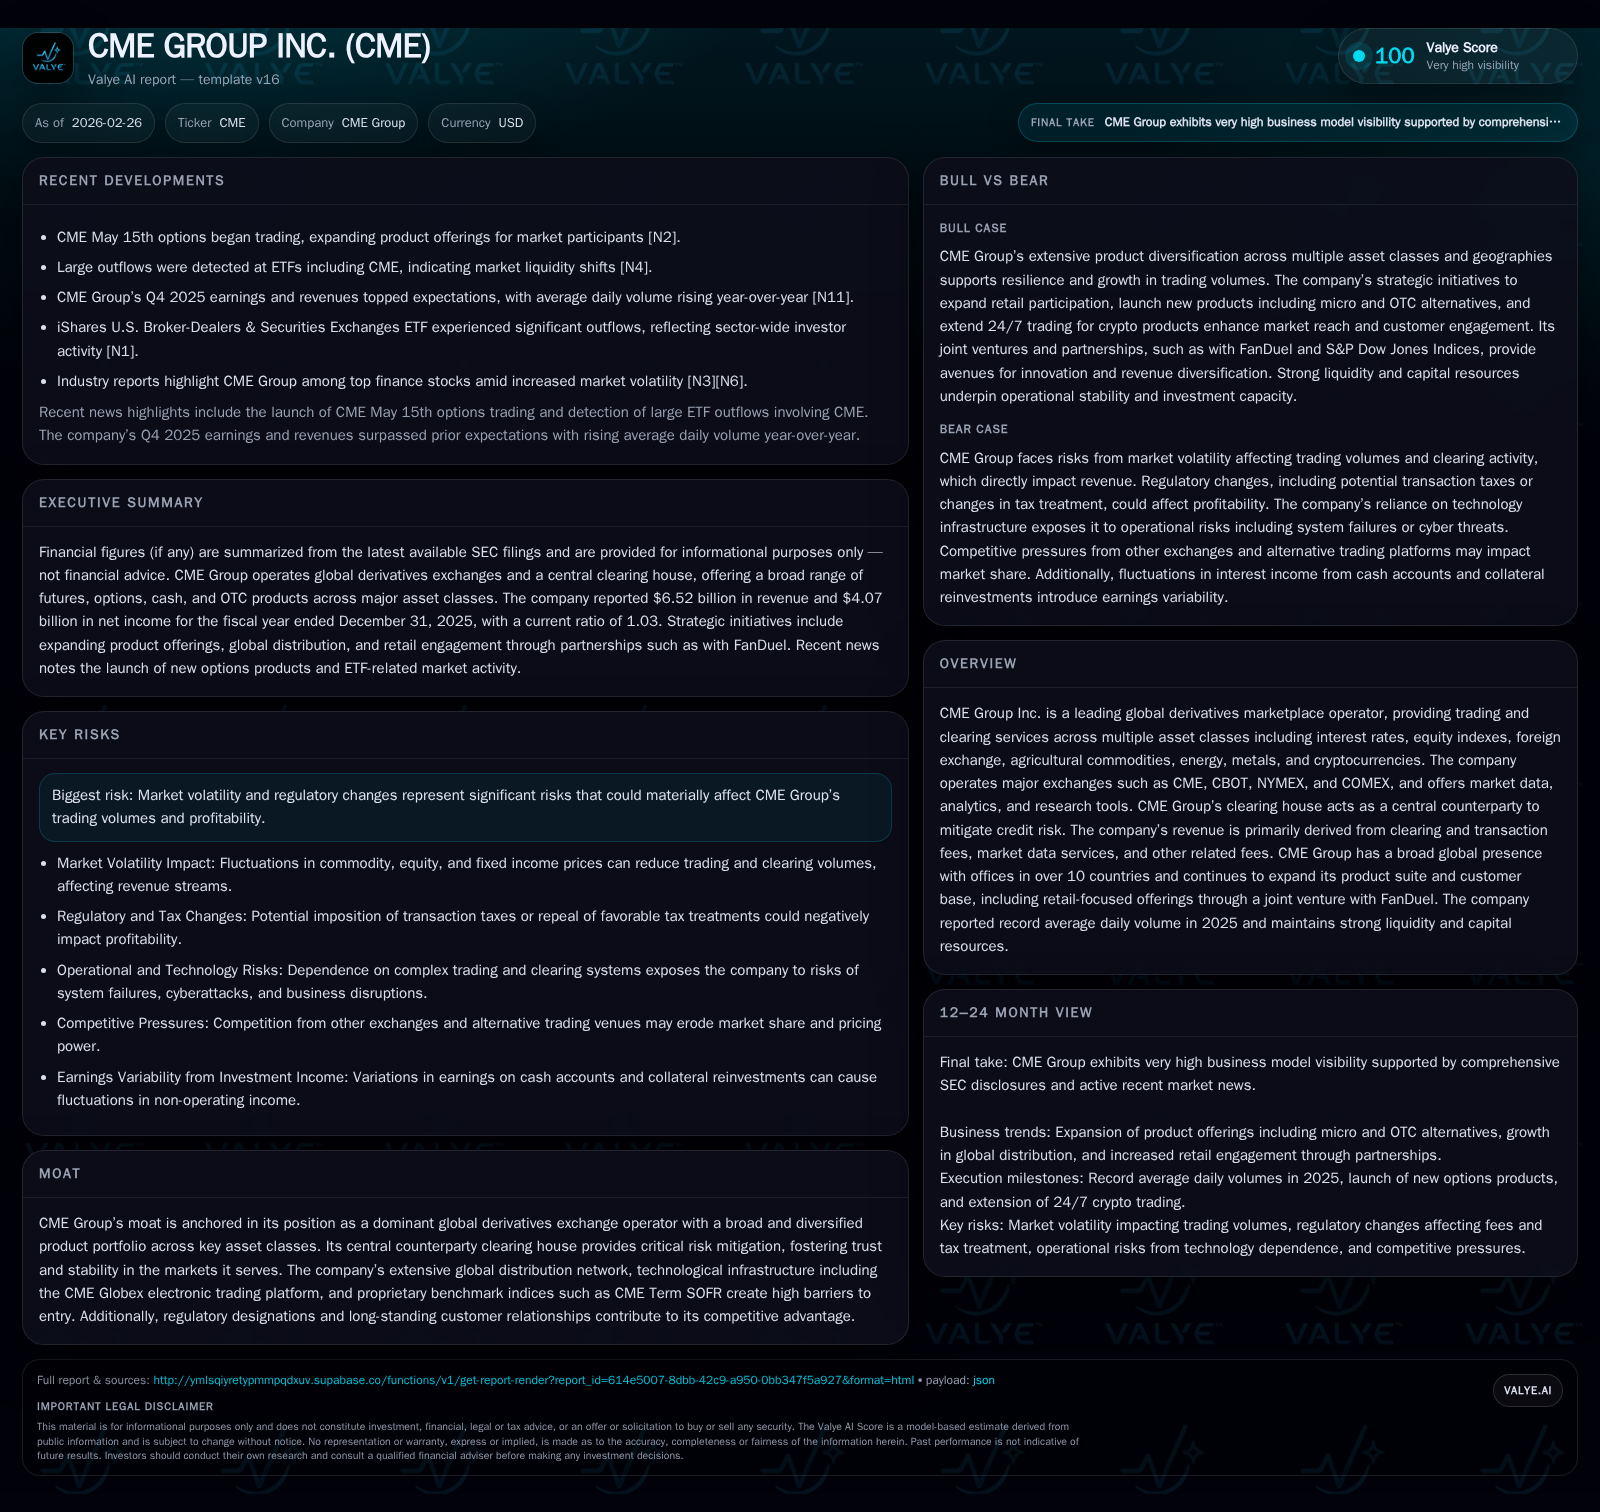
CME Group Inc. delivered strong financial performance in 2025, highlighted by record average daily volume across multiple asset classes and a broadening of its product portfolio to include new micro contracts and an expanded crypto suite. Revenue rose 6.4% year-over-year to $6.52 billion, driven by growth in clearing and transaction fees as well as market data services. The company’s substantial cash flows supported significant dividend payouts, while capital expenditures declined as cloud migration progresses. Going forward, CME aims to deepen its global footprint, innovate with new contract offerings, and leverage its central counterparty clearing house to navigate market volatility and regulatory shifts.
Overview
CME Group Inc., the world’s leading derivatives marketplace operator, strengthened its global dominance across interest rates, equity indexes, commodities, foreign exchange, metals, and cryptocurrencies throughout the 2025 fiscal year. Leveraging flagship exchanges CME, CBOT, NYMEX, and COMEX alongside electronic trading platforms such as CME Globex and BrokerTec, CME Group supports deep liquidity pools fundamental to risk management globally [S6]. The company’s integrated clearinghouse remains critical as a central counterparty that mitigates credit risk for participants.
Historical Performance
CME’s financial results reflect steady growth underpinned by expanding transaction volumes and diversification into data services:
Historical performance (annual)
| FY | Rev ($bn) | Net ($bn) | CFO ($bn) | OpInc ($bn) | Rev YoY | Net YoY |
|---|---|---|---|---|---|---|
| 2025 | 6.5 | 4.1 | 4.3 | 4.2 | +6.4% | +15.5% |
| 2024 | 6.1 | 3.5 | 3.7 | 3.9 | +9.9% | +9.3% |
| 2023 | 5.6 | 3.2 | 3.5 | 3.4 | +11.1% | +19.9% |
| 2022 | 5.0 | 2.7 | 3.1 | 3.0 |
Source: SEC companyfacts cache [F1].
Capital returns and efficiency (annual)
| FY | Div ($bn) | FCF ($bn) | ROE% |
|---|---|---|---|
| 2025 | 3.9 | 4.2 | 14.2 |
| 2024 | 3.6 | 3.6 | 13.3 |
| 2023 | 3.2 | 3.4 | 12.1 |
| 2022 | 2.6 | 3.0 | 10.0 |
Source: SEC companyfacts cache [F1].
CME has exhibited consistent top-line expansion averaging mid-single-digit growth annually since at least 2022 supported by surging volume across major derivative categories and complementary increases in market data revenues [F1]. Operating income outpaced revenue growth due to fixed cost leverage stemming from scalable electronic venues and effective cost management.
The net income advance ahead of revenue signals improved operational efficiencies and favorable income tax or other non-operating factors that improved bottom-line margins year-over-year [F1]. Operating cash flow also surged nearly 16%, driven by profitable operations that generate strong cash returns enabling generous dividend distributions totaling $3.93 billion in the most recent fiscal year [F1]. Capital spending moderated with an ongoing shift toward cloud infrastructure reducing on-premise facility investments without hampering technology modernization efforts.
Growth Drivers and Strategic Initiatives
Key future growth prospects are grounded in CME’s continuous product innovation and global expansion strategies:
Product Diversification: CME Group accelerated launches of micro-sized futures and options contracts across all six core asset classes—interest rates, equities, FX, agriculture, energy, metals—to cater to emerging retail investors seeking lower barrier entry points [S15]. Additionally, significant momentum in recently launched OTC alternative products signals unlocking new client segments.
Cryptocurrency Trading: The company expanded its crypto derivative offerings including Bitcoin, Ether, Solana & XRP futures with plans underway to enable full weekend trading hours starting Q2 2026 for enhanced hedging opportunities around the clock [S13].
Retail Expansion: The joint venture with FanDuel initiated late December introduced accessible prediction markets leveraging simplified event contracts that attract retail customers beyond traditional professional traders—a relatively novel distribution channel for CME [S10].
Cash Markets Growth: Broader adoption of BrokerTec electronic platforms for fixed income instruments such as U.S Treasuries—with launches like BrokerTec Chicago—complements futures trading by facilitating dealer-to-dealer liquidity closely aligned with underlying cash markets [S6][S18]. Furthermore, EBS provides competitive FX spot venues with the launch of the FX Spot+ platform linking OTC spot FX with futures liquidity improving market efficiency.
Clearing Services Expansion: The recent SEC approval granted to subsidiary CMESC to act as a securities clearing agency enables CME Group's entry into U.S Treasury repos clearing ahead of regulatory mandates effective end-2026/early-2027 potentially capturing incremental volumes and capital efficiencies afforded by unified clearing models [S18].
Global Footprint: CME is actively broadening its sales presence internationally including a recently established office in Dubai targeting Middle East markets while seeing elevated trading during European (+6%) and Asia-Pacific (+13%) hours underpinning revenues from diverse geographies beyond the U.S.—with over half of market data revenues sourced outside domestic borders increasingly [S10][S13].
Competitive Moat and Market Positioning
CME Group’s durable moat comprises its unmatched global derivatives footprint combined with robust technological infrastructure including the proprietary CME Globex platform which facilitates low-latency electronic trading across asset classes accompanied by deep liquidity critical for efficient price discovery . The group benefits from substantial recurring revenues stemming not only from transaction fees but also from high-margin market data services licensing proprietary indices such as CME Term SOFR—a benchmark endorsed by influential regulatory bodies like the Federal Reserve Board—and exclusive licensing arrangements with S&P Dow Jones Indices LLC further fortifying product differentiation [S15].
Its central counterparty clearinghouse remains industry-leading given its comprehensive margining tools leveraging SPAN methodologies that deliver billions in daily capital savings to clients reinforcing trust in managing credit risks across clearing firms worldwide [S9].
Risks and Challenges
The principal risks transparent within filings relate to regulatory shifts affecting fee structures or geographic restrictions which could constrict participation or raise compliance costs considerably; rapid technology evolution requiring significant investment amidst transitioning cloud infrastructures; potential volatility-induced fluctuations in volumes impacting revenues; third-party dependencies for execution connectivity; cybersecurity threats potentially disrupting operational continuity; intellectual property challenges; competitive pressures from incumbent exchanges like ICE or Cboe as well as innovative entrants targeting niche products or business models; macroeconomic factors such as interest rate environments impacting hedging demand; tax policy changes including potential repeal of favorable futures taxation treatment—all posing material uncertainties that management monitors vigilantly [S4][S7][S12][S14][S17][N13].
Returns and Capital Allocation
CME Group maintains a disciplined capital return approach highlighted by its substantial dividend distribution which totaled nearly $3.93 billion in fiscal year 2025—a figure growing alongside earnings power reflecting balance sheet strength supported by $4.42 billion cash reserves at year-end—underscoring ample liquidity availability for sustaining shareholder payouts while funding strategic initiatives [F1]. Capital expenditures contracted modestly (-11%), signaling efficiency gains amid transitions such as moving operations onto Google Cloud platforms reducing reliance on physical hardware environs yet maintaining robust infrastructural capabilities required for ultra-low latency trading systems integral to customer retention and trust [F1][S29].
Approximately calculated return on equity stood at roughly 14% for FY25 representing solid profitability relative to equity base continuing a multi-year positive trend evidencing steady value generation for shareholders through operating discipline and scalable business models embedded within electronic markets technology ecosystems [F1].
Forecasts and Key Milestones To Watch (Analysis)
No explicit forward guidance was provided; however stakeholders should monitor:
- Progress on rolling out full weekend trading for crypto derivatives scheduled for Q2 2026,
- Launch timing and initial volume uptake by CMESC securities clearing agency anticipated later this year,
- Adoption rates of micro contract lines across asset classes reflecting retail participation,
- Execution success of geographic expansions including Dubai operations,
- Competitive responses particularly fee structure adjustments by rivals,
- Technological transition milestones especially pertaining to latency improvements post-Google Cloud migration. These milestones will materially influence revenue mix transformation trajectories over near-to-medium term horizons.[S10][N9]
Summary
In sum, CME Group concluded a robust fiscal year marked by record trading volumes across diversified products spanning traditional futures to nascent cryptocurrencies enriching its client base inclusively from institutional through retail channels supported by deep technological moats centered on scalability reliability underpinned by secure central clearing mechanisms vital during fluctuating market regimes. Its strong profitability metrics coupled with sustained cash generation enable continued generous capital returns even amidst necessary ongoing investments into innovative products expanding global reach. Nonetheless vigilance toward evolving regulatory environments competitive innovations technological risks remains critical given marketplace complexities embedding uncertainties elusive to precise forecasting but actively managed through diversified strategies. This positions CME Group strongly going forward although risks inherent given evolving market landscapes warrant close ongoing scrutiny.
This analysis summarizes available data without offering investment advice or price targets.
Disclaimer: This is research-only, informational analysis and not investment advice. It may include AI-generated interpretation and general industry context. Always verify important details using primary sources.
Comments