
CME Group's Diversified Derivatives Hub Accelerates Market Data Growth Amid Volume Shifts
CME Group reports resilient second-quarter results driven by expanding market data revenue and evolving trading patterns across asset classes.
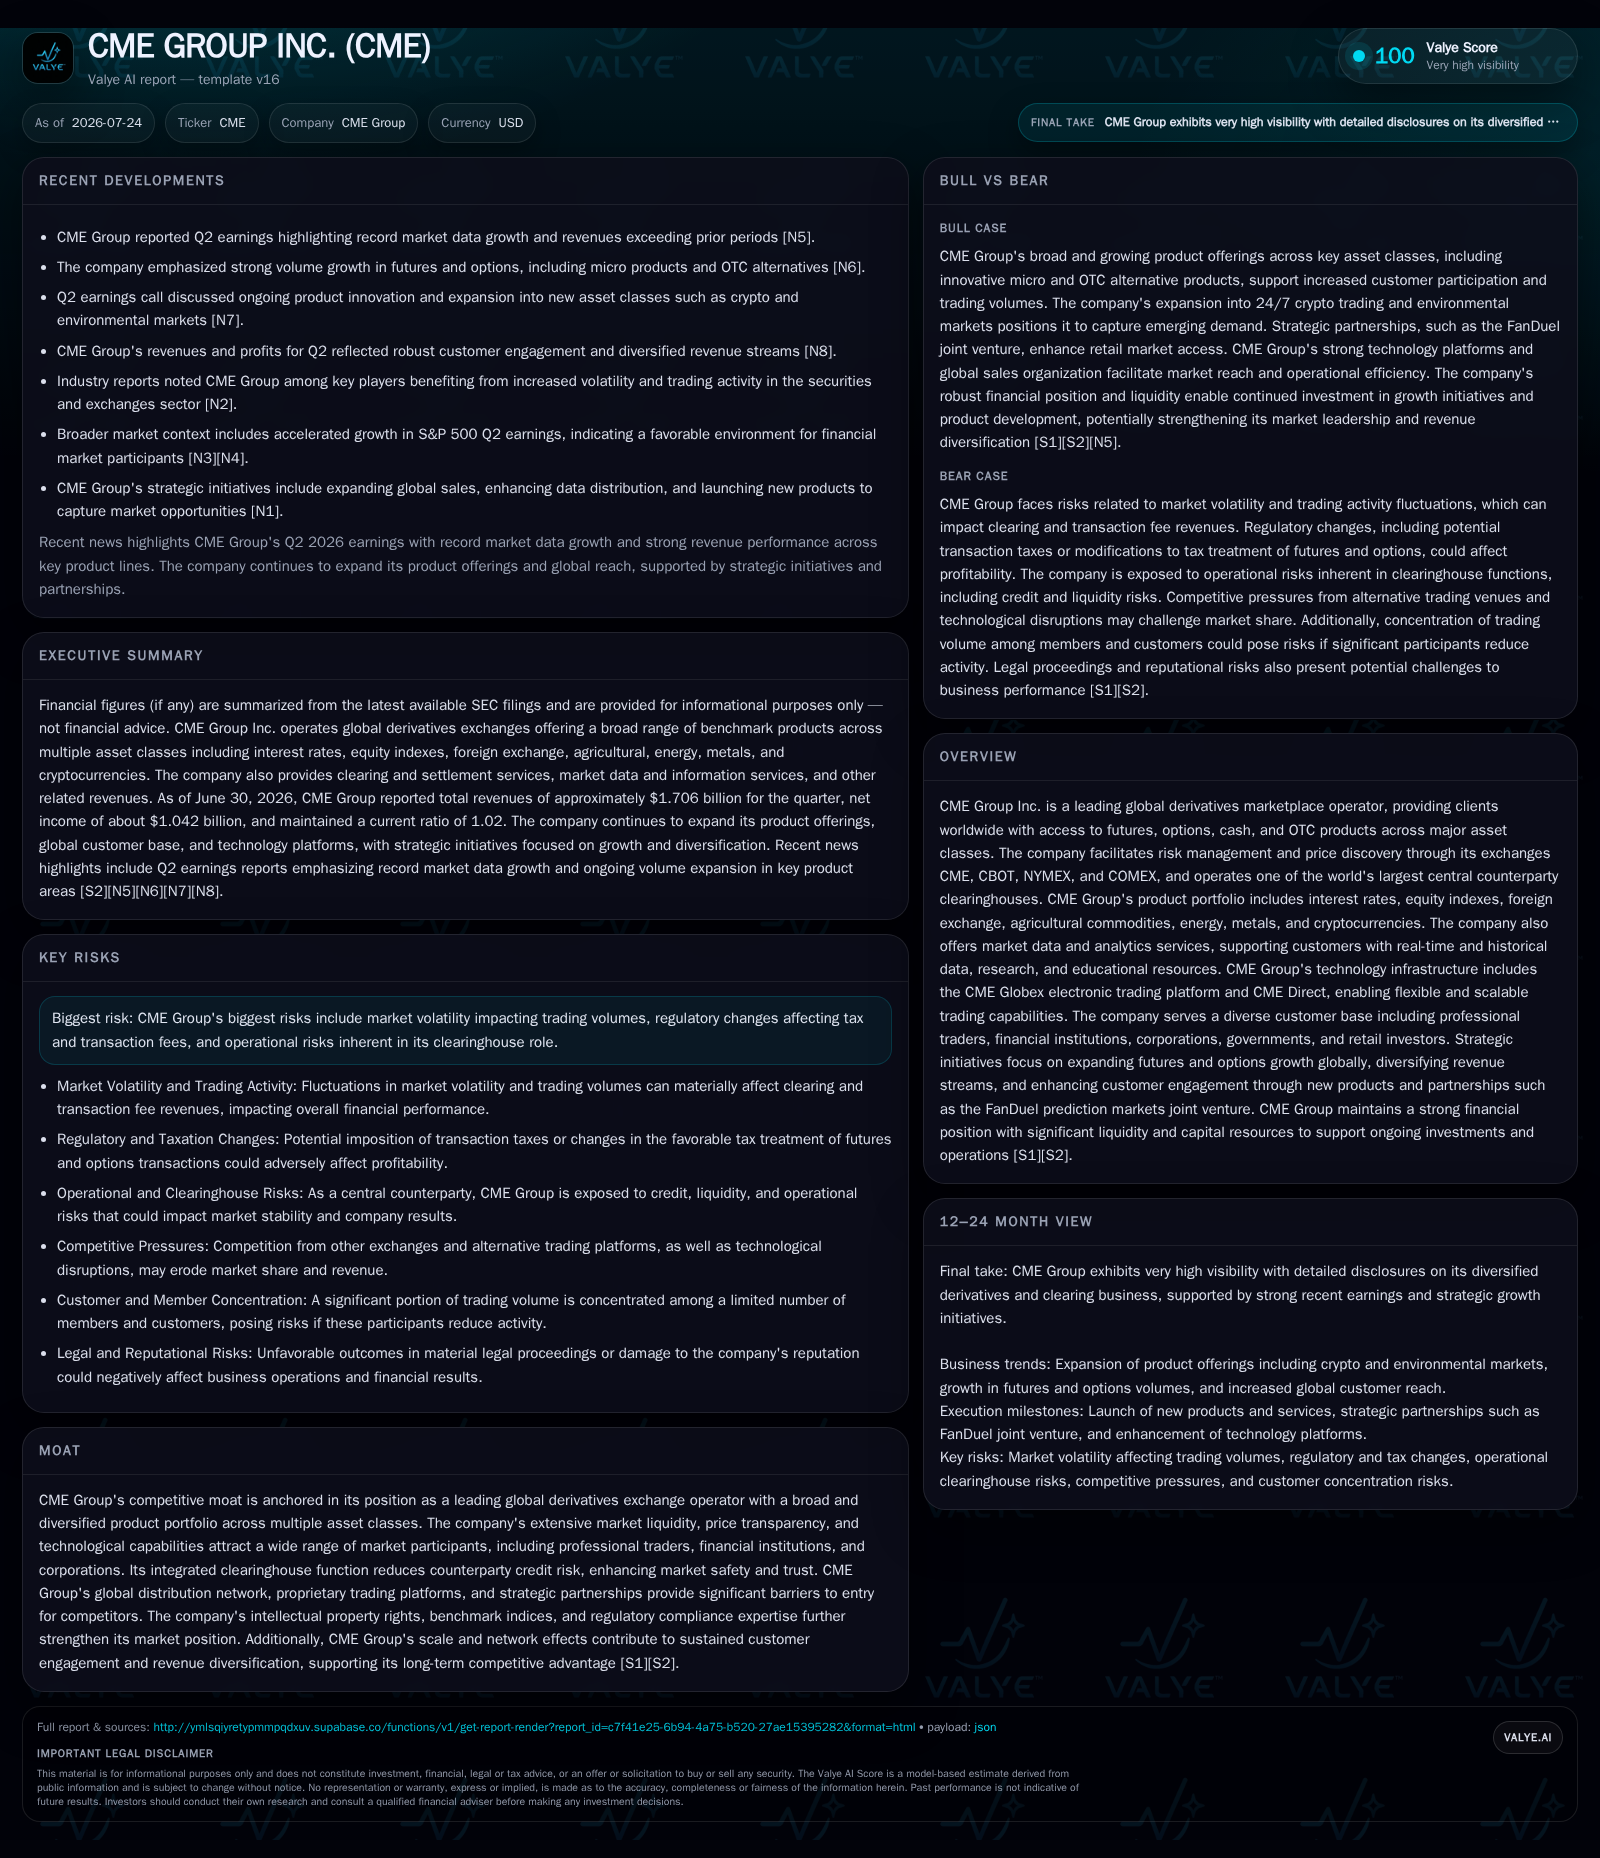
In its latest quarterly filing ending June 30, 2026, CME Group Inc. demonstrated solid financial and operational resilience with revenue growth supported primarily by a 20% increase in market data services, even as clearing and transaction fees saw modest decline due to volume mix shifts. The company continues to strengthen its position as a leading global derivatives exchange operator through product innovation, extended crypto trading hours, and robust clearinghouse risk management. However, regulatory pressures and variable contract volumes remain watchpoints. Ongoing technology investments and strategic expansions into new asset classes underpin CME's medium-term growth trajectory.
Recent Operating Update
CME Group’s Q2 2026 filing detailed nuanced shifts in its operating environment: Total revenues reached $1.706 billion for the quarter ended June 30, a slight decline from $1.692 billion year-over-year but reflecting diverging segment trends [S25]. The clearing and transaction fees line contributed $1.353 billion—a decrease of approximately 3% compared with $1.388 billion a year earlier—driven primarily by a contraction in total divided contract volume which averaged around 2.17 billion contracts this quarter [S25]. Meanwhile, market data revenues increased meaningfully by about 20% year-over-year hitting $238 million, highlighting growing appetite for CME's comprehensive benchmark indices, real-time feeds, and proprietary analytics offerings that support trade decision-making globally [S25][N5].
Notably, CME expanded its electronic trading capabilities by initiating full 24/7 trading on its crypto derivative suite starting in Q2 2026, addressing market participant demands for continuous hedging outside traditional business hours—a strategic move expected to enhance customer stickiness and diversify volume sources over time [S1]. These developments confirm CME's dual focus on maintaining core liquidity while innovatively capturing emerging asset-class growth.
Business Model
CME Group operates as an integrated derivatives exchange and central counterparty clearinghouse (CCP), connecting a broad spectrum of professional traders, financial institutions, corporations, and retail participants worldwide through its well-established exchanges: CME, CBOT, NYMEX, COMEX plus NEX Group Limited platforms [S2][S18]. Revenue principally derives from two synergistic streams: transaction-related clearing fees charged per futures or options contract executed and cleared; and recurring subscriptions for market data and analytics spanning both listed derivatives and cash markets across multiple asset classes including interest rates, equity indexes, FX, commodities, energy products, metals, and cryptocurrencies [S1][S25].
Transaction fee revenues fluctuate directly with total contract volume (measured in millions of round turns) and average fee per contract. The latter can shift due to product mix adjustments or pricing strategies reflecting competitive dynamics and regulatory considerations. Market data services represent a more stable recurring revenue source based on subscription and licensing models that monetize CME's intellectual property rights including benchmark indices such as the S&P futures series [S1][S10]. Operating margins benefit from high fixed-cost leverage on the electronic platforms (notably CME Globex) and economies of scale within the clearinghouse infrastructure that mitigates counterparty credit risk across participants.
The company’s single reportable segment consolidates these revenues and operating expenses enabling streamlined resource allocation decisions focused on sustaining technological leadership while managing controlled cost structures amidst growing platform complexity including the ongoing migration to Google Cloud environments [S2][S18].
Industry Structure and Competitive Position
As a top-tier global derivatives exchange operator alongside peers like Intercontinental Exchange (ICE) and Nasdaq’s OMX division, CME Group holds a commanding position characterized by deep liquidity pools in major futures contracts which are foundational for effective price discovery across interest rate curves, equity indices, FX pairs, commodities, and now cryptocurrencies. Its integrated CCP role fortifies this dominance by providing trusted clearing services critical to systemic risk reduction mandated by post-2008 financial reforms.
CME differentiates through breadth of product portfolio spanning over several thousand contracts combined with innovative product launches targeting specific sub-segments such as Treasury bills futures or mortgage-to-be-announced (TBA) instruments [S1], ensuring relevance across institutional hedgers’ needs. Its proprietary technology platforms Globex and CME Direct maintain high uptime with low-latency executions capable of handling surges in electronic order flow—an increasingly important competitive edge given rising trend towards algorithmic and high-frequency trading.
Regulatory compliance expertise coupled with global distribution partnerships create significant barriers to entry for newer venues attempting to disintermediate traditional exchanges. Nonetheless, competition is intensifying from emerging digital asset platforms offering alternative execution models for crypto derivatives as well as some OTC marketplaces internalizing liquidity flows absent centralized clearing which challenges fee capture dynamics [S7][S10]. In response CME’s enhancements to extend crypto trading hours aim directly at preserving volume share from weekend decentralized exchanges.
Growth Drivers
Several structural growth opportunities underpin CME’s outlook:
- Rising market volatility amid shifting macroeconomic conditions fuels demand for risk management tools via futures/options contracts across asset classes.
- Expansion into new product areas, notably cryptocurrencies where continuous hedging needs have motivated the launch of full-weekend trading enhancing product attractiveness.
- Market data monetization gains traction as institutional clients increasingly require sophisticated analytics layered on top of raw price feeds.
- Technological modernization such as hybrid-cloud migration improves scalability allowing support for higher order volumes without compromising platform reliability.
- Global reach expansion facilitated by regulatory licenses (e.g., SEC approval for securities clearing operation in late 2025) broadens market accessibility.
- Algorithmic/electronic trading proliferation boosts daily contract volumes disproportionately benefiting leading exchanges with robust low-latency execution platforms.
KPIs like total contract volume fluctuations are predominantly subject to external macro cycles but can be partially managed via new product launches that attract incremental customer segments or extend trading hours capturing previously unavailable time slots evidence tangible attempts at growth acceleration [S25][N5]
Risks / Watchpoints / Growth Constraints
Despite its strengths CME faces several notable risks:
- Market volatility dependency: Trading volumes—and consequently clearing fee income—can vary significantly with broader economic activity reducing revenue predictability.
- Regulatory risks: Potential imposition of transaction taxes or changes eliminating favorable tax treatments (e.g., repeal of the longstanding 60/40 tax split) could dampen contract turnover or margin structure [S10][S23].
- Operational vulnerabilities: As a systemically important financial market utility (SIFMU), outages or cyberattacks pose reputational damage risks while necessitating sustained hefty investments in resiliency.
- Competitive threats: Alternative venues leveraging novel technologies or attractive pricing models may erode volume share requiring ongoing innovation.
- Concentration exposure: One clearing firm contributed approximately 12% of clearing fees in 2025; any withdrawal could trigger customer migration patterns impacting revenue until redistribution completes [S1].
- Policy uncertainty: Changes in tax policies or effective interest rates might indirectly affect derivatives traded quantities given their sensitivity to macro variables.
Mitigating these factors requires vigilant technology upgrades partnering with regulators proactively to shape evolving guidelines while carefully monitoring pricing elasticity against peer moves.
What To Watch Next
Key milestones influencing CME’s near-to-medium term outlook include:
- Monitoring quarterly total contract volumes segmented by asset class for signs of sustainable recovery or stress beyond cyclical noise.
- Tracking adoption velocity of newly introduced products especially within credit markets plus enhanced TBA futures suite post-launch metrics.
- Subscription growth trends within market data services reflecting expanding penetration among institutional users.
- Technology platform metrics such as uptime/downtime statistics indicating successful cloud transition execution without user disruption.
- Regulatory developments especially US SEC regulations around securities clearing activities where newly received authorization opens new business avenues.
- Share repurchase program progress given substantial remaining authorization (~$1.5 billion), providing insight into management confidence regarding free cash flow sustainability [S12]
Continued disclosures on cybersecurity investment levels will also serve as indirect gauges of operational risk preparedness essential for ecosystem trust.
Financial Profile Discussion
As of June 30, 2026, CME Group reported cash & equivalents totaling approximately $2.14 billion with zero outstanding debt effectively delivering a net cash position that supports unlevered balance sheet strength ideal for supporting discretionary investment or capital return strategies without refinancing risk [F1][S13]. The current ratio is broadly stable around 1.02 reflecting balanced near-term liquidity despite large performance bond contributions held under custodial arrangements unrelated to core liquidity [F1].
Capital returns have been actively pursued with $1.2 billion of share repurchases completed excluding excise taxes during the six months ended June reflecting confidence in cash flow generation alongside sustained dividend payments consistent with past distributions [S12]. Marginally rising compensation costs plus technology expenses linked to cloud migration projects indicate management willingness to invest ahead of anticipated future scalability benefits balancing short-term margin impacts against long-term competitive positioning [S25][S18].
Overall capital allocation appears prudent focusing on accelerating recurring revenue streams while maintaining robust financial flexibility—a model aligned with industry peers maintaining technological excellence amid evolving regulatory demands.
This analysis is provided solely for informational purposes based on publicly filed financial disclosures without any research views regarding investment decisions.
Financial position in context
As of 2026-06-30, companyfacts shows $2.1bn in cash and equivalents and 0 USD of total debt [F1]. The same snapshot implies net debt of roughly $-2.1bn, keeping balance-sheet context relevant but secondary to the operating story [F1]. Current assets of $161.6bn and current liabilities of $158.7bn imply a current ratio near 1.02x for 2026-06-30 [F1].
Disclaimer: This is research-only, informational analysis and not investment advice. It may include AI-generated interpretation and general industry context. Always verify important details using primary sources.

Comments