
Halliburton’s Resilience Amid Middle East Disruptions and Technology-Enabled Segment Growth
Q2 2026 saw Halliburton navigate geopolitical headwinds while leveraging digital and operational strengths to sustain growth.
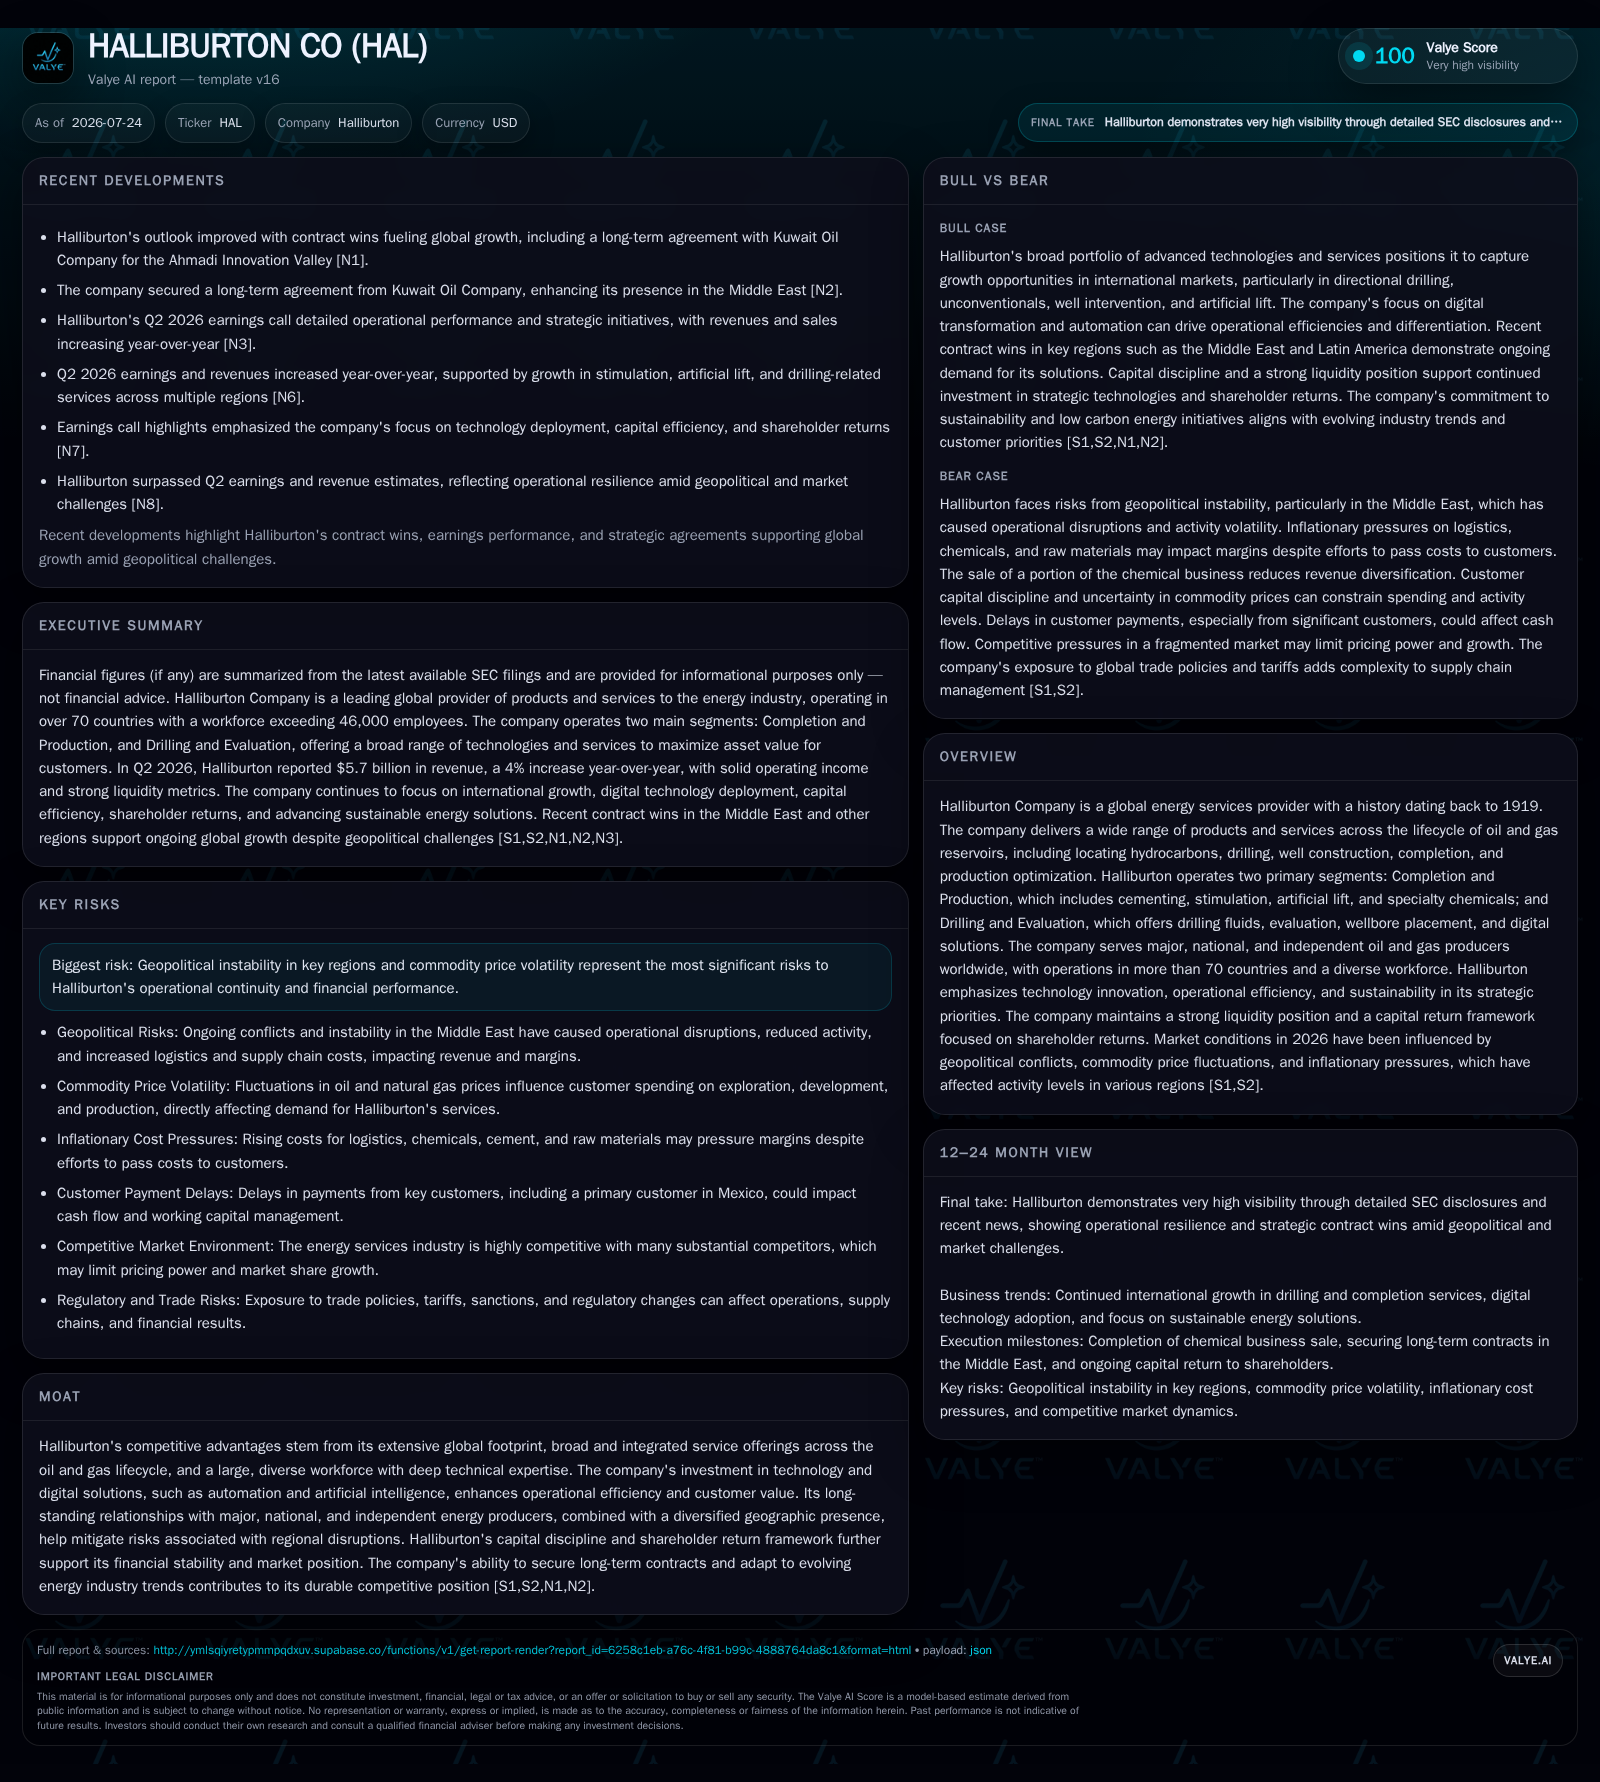
Halliburton reported a 4% revenue increase in Q2 2026 to $5.7 billion despite activity disruptions from Middle East conflicts. Growth was driven by improved drilling and evaluation services globally, especially in Latin America and Europe/Africa, offset partially by declines in Middle East/Asia. The company’s dual-segment model, focused on Completion and Production plus Drilling and Evaluation, benefits from diverse geographic exposure and technology investments like the Zeus IQ electric fracturing platform and LOGIX automation. Capital discipline remains strong with targeted $1.1 billion capex and robust liquidity of $2 billion cash plus credit facilities. Sustained shareholder returns through dividends and buybacks are prioritized amid ongoing industry cyclicality and geopolitical risk.
Recent Operating Update: Navigating Geopolitical Volatility during Incremental Growth
Regionally, Halliburton’s geographic diversification emerged as a buffer against localized turmoil. North America revenues held steady with better well construction and stimulation activity balancing out lower specialty chemicals sales due to a completed chemical business sale [S17]. Latin America contributed growth particularly via stimulation services and artificial lift activities. Europe/Africa/CIS delivered an impressive 24% revenue increase driven by enhanced well construction, intervention services, and completion tool sales across key markets such as Angola, Nigeria, Norway, Ivory Coast, Namibia, Mediterranean basin, and North Sea operations [S26]. Conversely, the Middle East/Asia region recorded an 11% contraction due primarily to conflict-related service disruptions in Saudi Arabia, Iraq, Qatar, Kuwait, along with reduced wireline activities across Asia [S26].
Halliburton's strategic divestment of part of its chemical business during Q2 also contributed to pressure on Completion & Production segment revenues which remained flat overall year-over-year despite pockets of growth [S12,S17]. Activity mix shifts — including reduced stimulation services pricing especially in US Land — further weighed on profitability metrics within this segment [S17]. Meanwhile the Drilling & Evaluation segment benefited from increased demand for drilling fluids, directional drilling solutions such as the iCruise rotary steerable system, wellbore placement technologies, wireline testing services outside disrupted areas, and expanded software-enabled project management capabilities [S12].
Business Model: Integrated Service Provider Across the Oilfield Lifecycle
Halliburton operates through two main segments aligned with key upstream oilfield service phases: Completion and Production; Drilling and Evaluation [S1,S12]. Completion & Production encompasses cementing operations that ensure well integrity; hydraulic stimulation including fracturing fluids; specialty chemicals tailored to formation conditions; artificial lift solutions such as electric submersible pumps; pipeline/process services enhancing surface asset productivity; alongside production enhancement and intervention products fostering reservoir recovery maximization. Drilling & Evaluation focuses on providing essential drilling fluids (Baroid), drill bits/services critical to penetration rates, reservoir modeling software (Landmark), wireline/evaluation tools for precise downhole data capture, testing services validating completion success, subsea hardware support for offshore environments, plus project management consulting embedded into operator workflows.
Monetization derives from contracted project work with major international oil companies (IOCs), national oil companies (NOCs), independents spanning conventional fields to highly complex shale plays globally [S1]. Revenue drivers couple volume-based services—such as fluids pumped or wells serviced—with pricing linked to commodity cycles influencing capital expenditure budgets of upstream operators. Continued digitization efforts aim to shift part of the value proposition towards efficiency-enhancing software-as-a-service components integrated into comprehensive field execution packages.
The company's long operational history since 1919 combined with broad operational reach into over seventy countries confers scale advantages but necessitates navigating region-specific political risks [S1,S12]. Manufacturing hubs located principally in the U.S., Malaysia, Singapore, U.K., supply most equipment internally enabling workflow control while also exposing the company to supply chain complexities inherent to global industrial manufacturing [S12,S19].
Industry Structure & Competitive Position
Halliburton's competitive positioning reflects its scale as one of the world's largest oilfield services providers alongside peers Schlumberger—similarly integrated across upstream lifecycles—and Baker Hughes with diversified product offerings. While Schlumberger leads with arguably broader digital service penetration globally, Halliburton distinguishes itself through targeted investments in electric fracturing platforms like Zeus IQ designed for efficiency gains amid tightening emissions regulations [S1,S12,N9]. The company’s LOGIX automation platform exemplifies its push towards integrating industrial IoT capabilities within field operations.
The industry's client base comprises national oil companies looking for long-term partnerships tied to large-scale exploration/development programs—as seen recently with contract awards from entities like Saudi Aramco’s Jafurah Gas Project as reported externally but reflecting ongoing core market penetration strategies—which helps underpin backlog visibility notwithstanding cyclicality related to fluctuating hydrocarbon prices [N8,N11]. However, high capital intensity across drilling fleets coupled with regulatory scrutiny around environmental practices imposes ongoing margin pressure relative to less capital-intensive digital-centric tech firms entering this space.
Growth Drivers
Key growth vectors for Halliburton align with broader upstream exploration expansion replenishing depleting reserves amid rising global energy demand forecasts. In particular:
- International expansion focused on unconventionals where directional drilling sophistication creates higher service intensity per well drilled.
- Digital transformation enabling productivity enhancements cementing customer loyalty via automation tools like LOGIX automating complex frac stages.
- Electrification efforts through platforms such as Zeus IQ associating sustainability objectives with customer operational cost reductions.
- Expansion of artificial lift installations improving recovery rates amid maturing field profiles internationally.[S1,S12]
- Long-term contracts secured from NOCs fostering stability against commodity price swings.
Monitoring rig utilization trends especially outside U.S. markets serves as an indicator of underlying activity traction reflecting these growth initiatives.
Risks & Watchpoints
Halliburton faces persistent risks common within oilfield services:
- Geopolitical instability: Ongoing Middle East conflicts have already disrupted operational activity materially during Q2 2026 with uncertain duration or escalation potential critical for multinational asset planning [S2,S26].
- Commodity price volatility: Upstream capex budgeting is sensitive to unpredictable crude price swings impacting customer spend discretion.
- Execution risks on SAP S4 IT migration may temporarily increase costs or disrupt analytics capacity during planned Q4 completion phase impacting operational transparency [S22,S26].
- Environmental regulatory tightening driving higher compliance expenses potentially constraining near-term margins.
- Receivable concentration risks notably exposure in Mexico where delayed payments exist but have not yet deteriorated beyond recoverability norms
What To Watch Next
Key milestones signaling operational momentum include:
- Quarterly updates on rig utilization rates segmented by region providing forward-looking clues into activity pacing.
- Post-Q3 confirmation of SAP S4 system ramp-up impact on SG&A efficiency.
- Contract award announcements especially from key NOC customers in Middle East/Asia reinforcing international expansion strategy.
- Progress updates regarding technology deployments including electric fracturing units transitioning further North American fleets.
- Capital allocation pace maintaining at targeted ~$1.1 billion level supporting innovation balanced against shareholder return framework emphasizing >50% free cash flow distribution via dividends/buybacks [S22]
Financial Profile Discussion
As of June 30, 2026, Halliburton held $2.0 billion in cash and equivalents, supported by a $3.5 billion revolving credit facility expiring August 2030, providing ample liquidity amidst prevailing market uncertainties with no financial covenants restricting flexibility [S2]. Current assets totaled approximately $11.9 billion against current liabilities near $5.9 billion, implying a current ratio of about 2.02x as of June 30, 2026 [F1].
Total debt was last reported near $7.16 billion as of March 31, 2025, with net debt around $5.1 billion at that time, though more recent figures have not been explicitly disclosed [F1]. Credit ratings remain stable investment-grade (BBB+ S&P / A3 Moody’s), reflecting a balanced leverage profile and strong free cash flow prospects reinforced by a diversified service portfolio and global footprint moderating single-region risk concentrations.
This analysis is provided for informational purposes only without any investment research view or advice concerning Halliburton Company securities or commodities exposure associated with the energy sector.
Disclaimer: This is research-only, informational analysis and not investment advice. It may include AI-generated interpretation and general industry context. Always verify important details using primary sources.

Comments