
California Resources Navigates Post-Merger Integration and Capital Deployment
Analyzing CRC’s financial performance, integration challenges, and capital allocation amid a transformative merger with Berry Corporation.
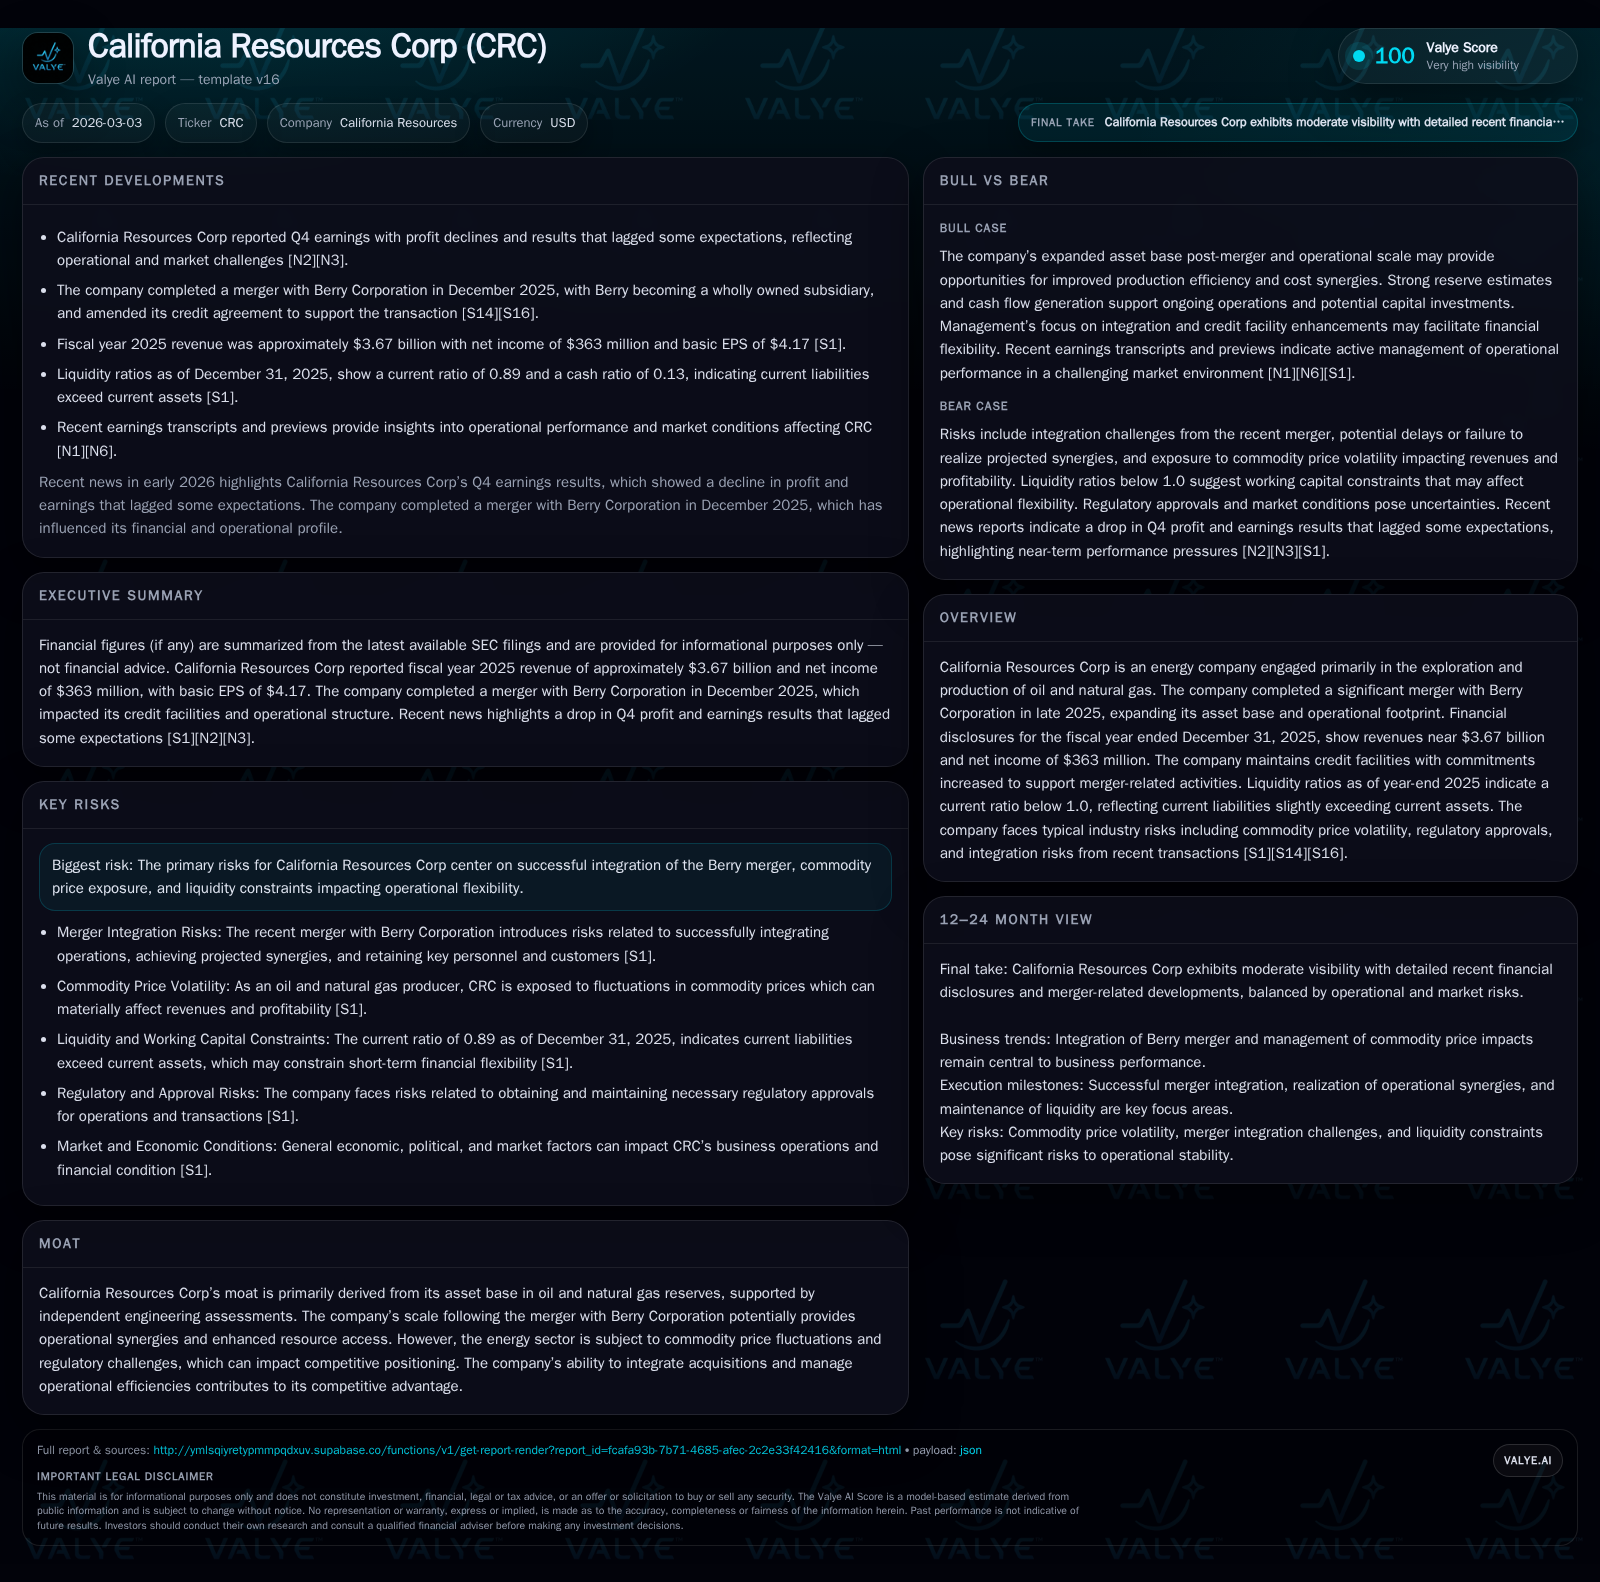
California Resources Corporation (CRC) completed its merger with Berry Corporation in 2025, resulting in a 14.7% revenue increase to $3.67 billion. Despite higher revenues, operating income and net income declined modestly by 3.5% each, reflecting integration expenses and margin pressures. Operating cash flow grew significantly by 41.8% to $865 million, supporting increased capital expenditures of $322 million. The company’s current ratio was 0.89 at year-end, indicating liquidity pressures amid elevated current liabilities. Shareholder returns expanded with dividends reaching $136 million and share repurchases rising to $377 million. Key risks include regulatory approvals, synergy realization, and commodity price volatility, which will influence CRC’s future growth and financial stability.
Financial Performance Overview Post-Merger
California Resources Corporation (CRC) reported a revenue increase of 14.7% in fiscal year (FY) 2025 to $3.67 billion compared with $3.20 billion in FY2024, driven primarily by the completion of its merger with Berry Corporation [F1]. However, operating income declined by 3.5% to $598 million from $620 million the previous year, reflecting integration expenses and margin pressures associated with combining operations [F1]. Net income followed a similar trend, decreasing by 3.5% to $363 million in FY2025 versus $376 million in FY2024 [F1].
Historical performance (annual)
| FY | Rev ($bn) | Net ($mm) | CFO ($mm) | OpInc ($mm) | Rev YoY | Net YoY |
|---|---|---|---|---|---|---|
| 2025 | 3.7 | 363 | 865 | 598 | +14.7% | -3.5% |
| 2024 | 3.2 | 376 | 610 | 620 | +14.2% | -33.3% |
| 2023 | 2.8 | 564 | 653 | 808 | +3.5% | +7.6% |
| 2022 | 2.7 | 524 | 690 | 812 |
Source: SEC companyfacts cache [F1].
Capital returns and efficiency (annual)
| FY | Div ($mm) | Buybacks ($mm) | FCF ($mm) |
|---|---|---|---|
| 2025 | 136 | 377 | 543 |
| 2024 | 113 | 192 | 355 |
| 2023 | 81 | 143 | 468 |
| 2022 | 59 | 313 | 311 |
Source: SEC companyfacts cache [F1].
Table: Historical Financial Performance Summary [F1]
Operational and Integration Dynamics
The merger expanded CRC's asset base significantly within California’s oilfields, supporting top-line growth [S1]. Nonetheless, operating income contraction is largely attributed to merger-related costs such as systems integration, restructuring efforts, and increased corporate overhead during the transition period [N1]. Commodity price fluctuations also posed challenges; although hedging mechanisms mitigated some volatility effects, profitability remained sensitive to market conditions [N2].
Synergy realization has faced delays due to complexities in aligning operational processes across combined assets [S10]. Regulatory approvals remain ongoing with potential conditions that could affect full asset utilization [S4][S6][S9][S12]. Retaining critical personnel amid organizational changes also poses risks to operational continuity.
Liquidity Position and Capital Structure Considerations
At December 31, 2025, CRC reported current assets of approximately $938 million against current liabilities near $1.05 billion, resulting in a current ratio of about 0.89 [F1]. This below-unity ratio highlights short-term liquidity pressures that may constrain flexibility absent access to credit facilities.
To address financing needs related to the merger and integration expenses, CRC increased its revolving credit commitments by roughly $300 million late in the year [S16]. The company also issued senior notes maturing in the mid-2030s with standard call features providing refinancing options based on market conditions [S26]. Managing leverage and covenant compliance will be critical as integration progresses.
Capital Allocation Strategy: Balancing Growth Investments and Shareholder Returns
Despite financial headwinds from integration activities, CRC increased shareholder returns substantially in FY2025. Dividends rose by about 20%, reaching $136 million while share repurchases more than doubled from $192 million to $377 million [F1]. Capital expenditures were elevated by over one-quarter year-over-year to $322 million targeting drilling programs and infrastructure upgrades for both legacy operations and newly acquired properties [F1][S13].
Free cash flow generation remained robust at an estimated $543 million (operating cash flow minus capex), supporting continued returns alongside reinvestment needs amid evolving operational demands.
Management Outlook and Key Risks
Management expressed cautious optimism regarding synergy capture timelines while emphasizing ongoing risks including commodity price volatility and regulatory uncertainties [N1][N2]. Synergy milestones are expected over multiple quarters given operational complexities.
Capital deployment priorities focus on sustaining shareholder returns balanced with prudent reinvestment into core assets and efficiency improvements [S10][S11]. Forward-looking guidance remains limited as management concentrates on execution monitoring.
Investor Considerations: Monitoring Integration Progress and Market Conditions
Key factors for investors include:
- Progress against synergy targets relative to initial projections.
- Stability of quarterly operating cash flows amid rising capital expenditures.
- Leverage trends and compliance with amended credit agreements.
- Updates on regulatory approvals impacting asset utilization.
- Retention of essential technical personnel driving production optimization.
- Impact of commodity market fluctuations on earnings consistency.
These indicators will inform assessments of CRC’s ability to translate expanded scale into sustained profitability improvements [N5][N8][N11][S14].
This analysis is based exclusively on information available as of early March 2026 from SEC filings and recent earnings transcripts without speculative forecasts or investment advice.
Disclaimer: This is research-only, informational analysis and not investment advice. It may include AI-generated interpretation and general industry context. Always verify important details using primary sources.
Comments