
Crawford & Co Expands Case Volume Amid Stable Cost Management and Geographic Profit Gains
The latest quarter shows growth in case volumes driven by new disability clients and international segment profits improving despite mixed regional dynamics.
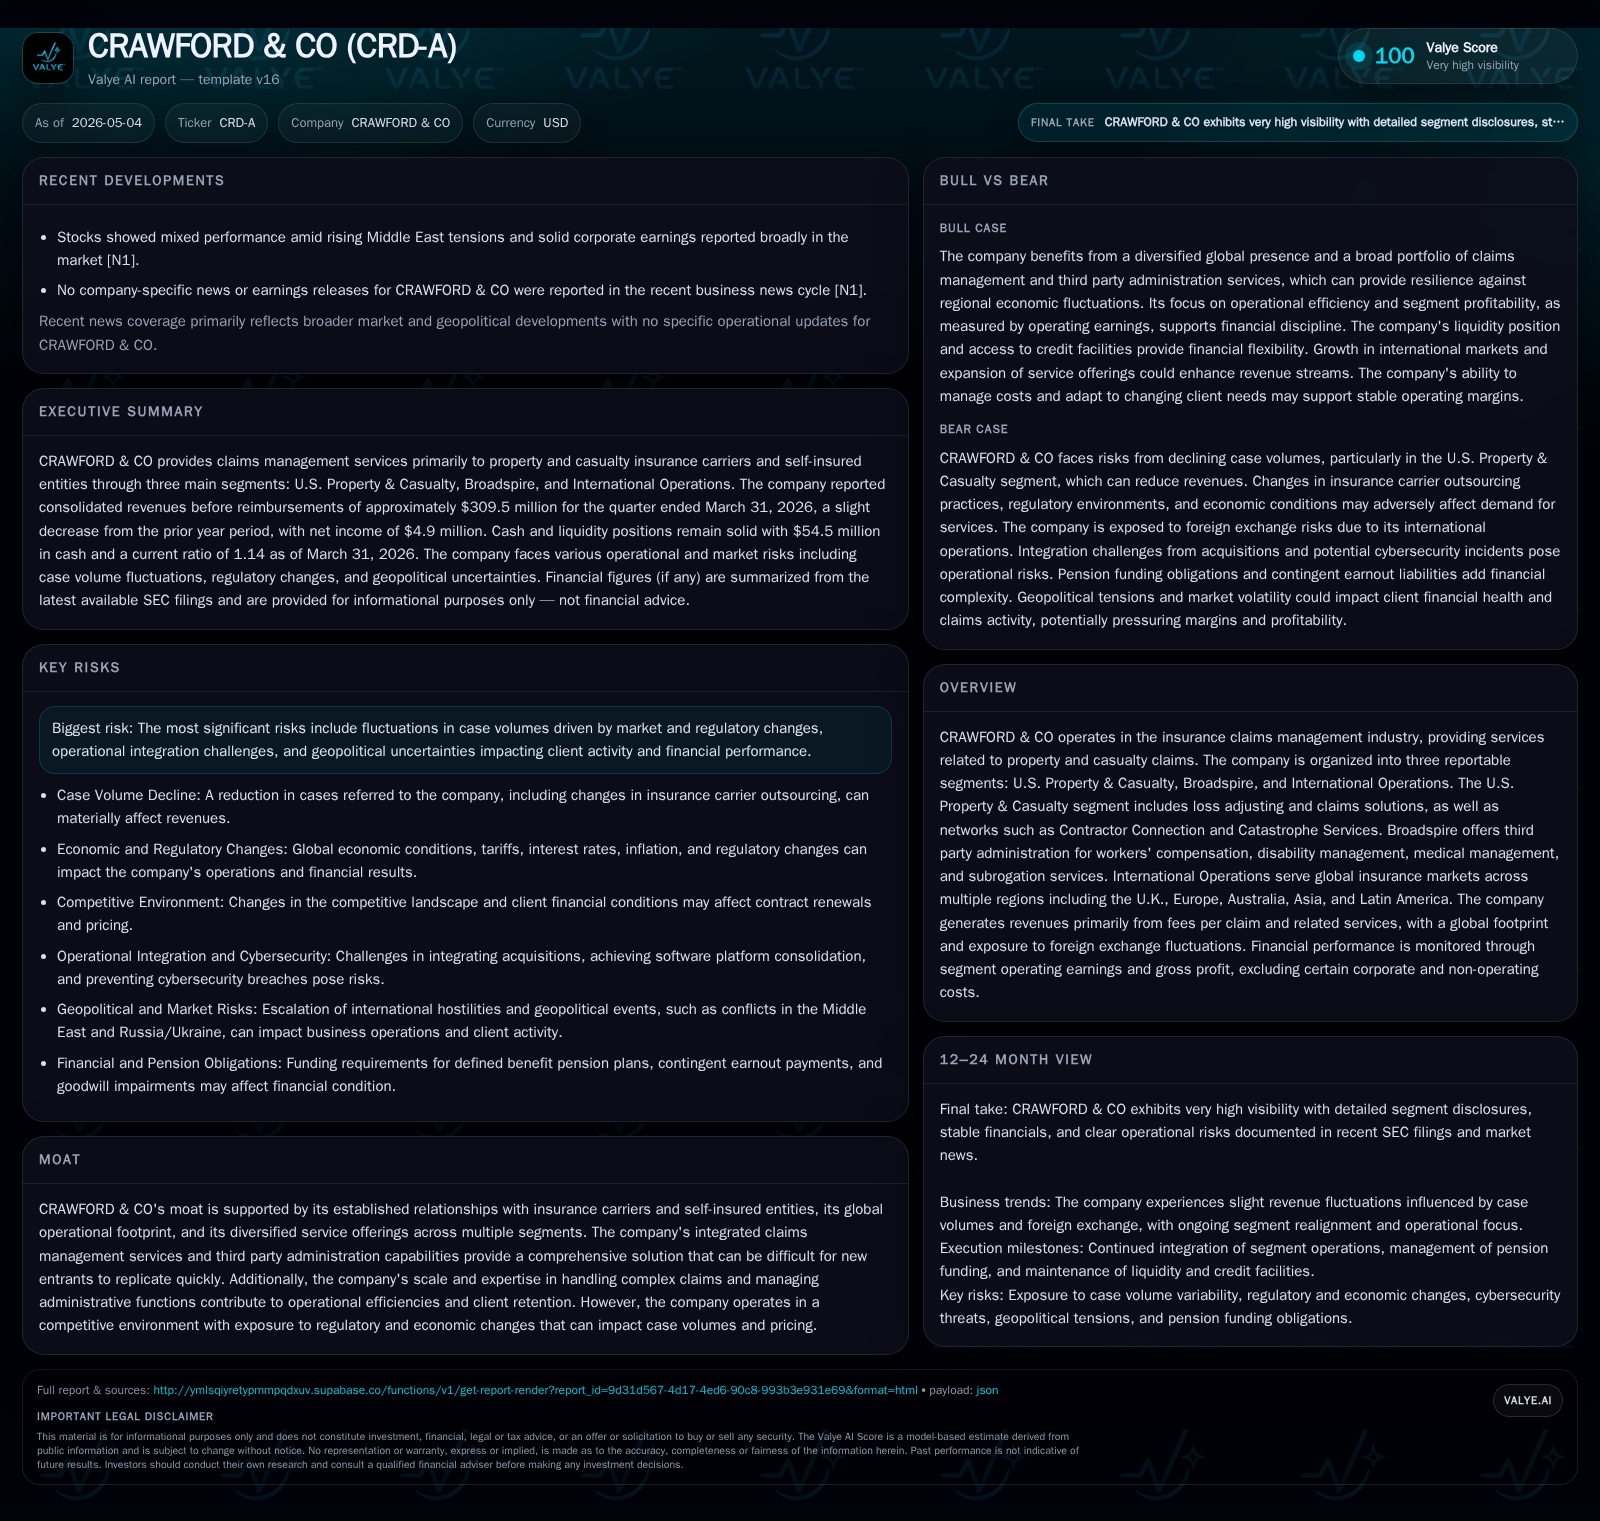
Crawford & Co's Q1 2026 results reveal an 8.7% increase in case volumes, primarily due to new disability clients and rising utilization management claims, offset slightly by subrogation case losses. Operating segments show mixed trends, with International Operations posting improved profits from Canada, Australia, and Asia, while the U.K. and Latin America face challenges. Cost controls contributed to a slight drop in service costs as a percentage of revenue, though SG&A expenses rose moderately due to self-insurance. Liquidity remains robust with $54.5 million cash and $329.9 million total liquidity under credit facilities.
Recent Operating Update
Crawford & Co’s first-quarter report for 2026 highlighted a substantive increase in total case volumes—up by 8.7% compared with the previous year—driven largely by onboarding new disability clients within its Claims Management services line as well as growth in physician review services and utilization management claims within Medical Management. This volume expansion was partially offset by a decline in subrogation cases following the loss of one customer [S2].
In terms of cost management, the company achieved a modest decrease in the costs of services provided (before reimbursements), down $0.5 million or 0.2%, maintaining an efficient cost ratio relative to revenues [S2]. Meanwhile, selling, general and administrative expenses increased by $1.6 million (2.1%), mainly attributable to an uptick in self-insurance expense which partially balanced out a decrease in contingent earnout costs related to previous acquisitions [S2].
The International Operations segment demonstrated enhanced profitability thanks primarily to stronger earnings from Canada, Australia, and Asia regions; however, these were partially offset by weaker performance in the U.K. and Latin America sectors [S24]. Overall operating earnings metrics exclude certain corporate allocations such as CEO/Board compensation costs, stock option expenses totaling approximately $0.2 million per quarter, amortization of acquisition-related intangibles ($1.8 million quarterly), pension-related non-service costs (~$2 million), unallocated legal costs, and income tax provisions [S20].
($17 million) and international subsidiaries ($37.5 million) [S2][F1]. Gross debt was approximately $150.6 million, resulting in a net debt position near $96 million [F1].
Business Model
Crawford & Co operates primarily as an insurance claims management service provider with comprehensive capabilities encompassing property and casualty (P&C) claims adjustment along with third-party administration for workers’ compensation and disability claims through its Broadspire division [S1]. The company segments its operations into three main reportable units:
- U.S. Property & Casualty: Encompasses traditional loss adjusting services coupled with proprietary networks like Contractor Connection that facilitate repairs and catastrophe response.
- Broadspire: Focuses on administrative services related to workers’ comp claims management, medical management including physician review services, disability management programs, and subrogation recovery activities.
- International Operations: Serves global markets across the U.K., Europe, Australia, Asia-Pacific, and Latin America delivering P&C claim solutions tailored to local markets.
Revenue derives principally from fees charged on a per-claim basis or project-specific contracts tailored to insurers or self-insured entities [S1]. Margins benefit from economies of scale given the firm’s geographic breadth combined with depth across multiple complementary service lines enhancing client retention through integrated offerings.
Employees’ compensation alongside outsourced labor represents Broadspire’s largest cost component given its heavy reliance on skilled adjudicators and medical professionals [S2]. Strategic investments have been made into IT infrastructure to bolster operational efficiency although capital expenditures have moderated recently [S4].
Industry Structure and Competitive Position
The insurance claims management industry is characterized by the outsourcability of claims handling functions but also distinguished by long-standing relationships with insurance carriers requiring reliability, compliance expertise, regulatory agility across jurisdictions,and data integrity.
Crawford holds competitive advantages stemming from:
- Established client ties with major insurers globally;
- Comprehensive end-to-end service offerings spanning simple claims adjustment through complex medical management;
- Scale effects enabling cost-effective claim resolutions;
- Proprietary technologies supporting claim workflow efficiency;
- Geographic diversification mitigating localized risk exposures.
Competition arises from both global third-party administrators (TPAs) expanding their footprint as well as insourced insurer functions attempting cost control measures internally [S1]. Regulatory developments impacting workers' compensation rules or catastrophe frequency also influence demand cyclicality.
Growth Drivers
The primary drivers include structural shifts where insurance companies increasingly outsource specialized claims processing tasks post-catastrophe or for specialty domains like disability benefits; this trend supports sustainable volume growth beyond cyclical weather-related spikes [S1][S2]. Additionally:
- Expansion into emerging markets within International Operations provides room for margin expansion through both organic growth initiatives and selective acquisitions.
- Innovation via technology investments aims to improve automation capabilities reducing labor intensity per claim while enhancing accuracy.
- Regulatory tightening around medical management is spurring demand for Broadspire’s physician review services driving higher-value engagements.
- Client portfolio diversification lessens dependency risks on any single account or region.
Risks and Growth Constraints
Key risks weigh on Crawford’s volumes driven by:
- Potential reversals or slowdowns in insurers’ outsourcing decisions affecting referrals;
- Heightened competition pressuring pricing flexibility;
- Foreign currency volatility impacting international revenue translation;
- Regulatory changes altering medical or disability claim frameworks potentially increasing complexity or reducing throughput;
- Integration risk from acquisitions possibly distracting management focus or diluting margins;
- Operational challenges managing self-insured liabilities reflected recently in rising SG&A expenses [S2];
- Uncertainty from macroeconomic factors affecting the insureds’ financial condition limiting claims activity or payment timeliness [S1][S2].
What To Watch Next
Investors should monitor updates on:
- Subsequent quarters’ case volume trajectory especially within disability and medical management categories,
- Regional profit margins particularly any sustained recovery signs within U.K./Latin America operations,
- Expense trends notably SG&A components tied to insurance liabilities,
- Pension plan funding obligations that could affect cash flow allocation,
- Currency exchange rates given earnings exposure across continents,
- Contract renewals or new client wins signaling competitive traction,
- Capital expenditure levels supporting platform enhancements.
Though not explicit guidance figures were noted for future periods in the recent filings, these operational parameters serve as key indicators tied directly to growth sustainability and margin performance dynamics.
Financial Profile (Brief)
Latest financial snapshot
| Metric | Value | Period |
|---|---|---|
| Cash & equivalents | $54mm | |
| 2026-03-31 | ||
| Total debt | $151mm | |
| 2026-03-31 | ||
| Net debt | $96mm | |
| 2026-03-31 | ||
| Current assets | $368mm | |
| 2026-03-31 | ||
| Current liabilities | $323mm | |
| 2026-03-31 | ||
| Current ratio | 1.14x | |
| 2026-03-31 |
Source: SEC companyfacts cache [F1].
At March 31, 2026, liquidity remains ample supported by credit facilities allowing for operational flexibility despite net leverage consistent with sector norms [S13][F1]. Operating cash flow generation showed improvement aided by better payables timing though earnings gains appear modest this quarter [S4][S7]. Dividend payments continued at roughly $3.7 million quarterly reflecting steady shareholder returns alongside strategic reinvestment appetite.
This analysis reflects information current as of May 4th, 2026 based on SEC filings including the latest quarterly report (10-Q) and recent event disclosures by Crawford & Company (CRD-A). It does not constitute investment advice but provides a comprehensive assessment of business operation nuances within their industry context aimed at informed evaluation.
Disclaimer: This is research-only, informational analysis and not investment advice. It may include AI-generated interpretation and general industry context. Always verify important details using primary sources.
Comments