
Comstock Resources Advances Haynesville Development with Bold Capex Plan as Margins Tighten
Comstock Resources' Q1 2026 results reveal a strategic ramp in drilling and infrastructure spending amid production decline but improved realized prices.
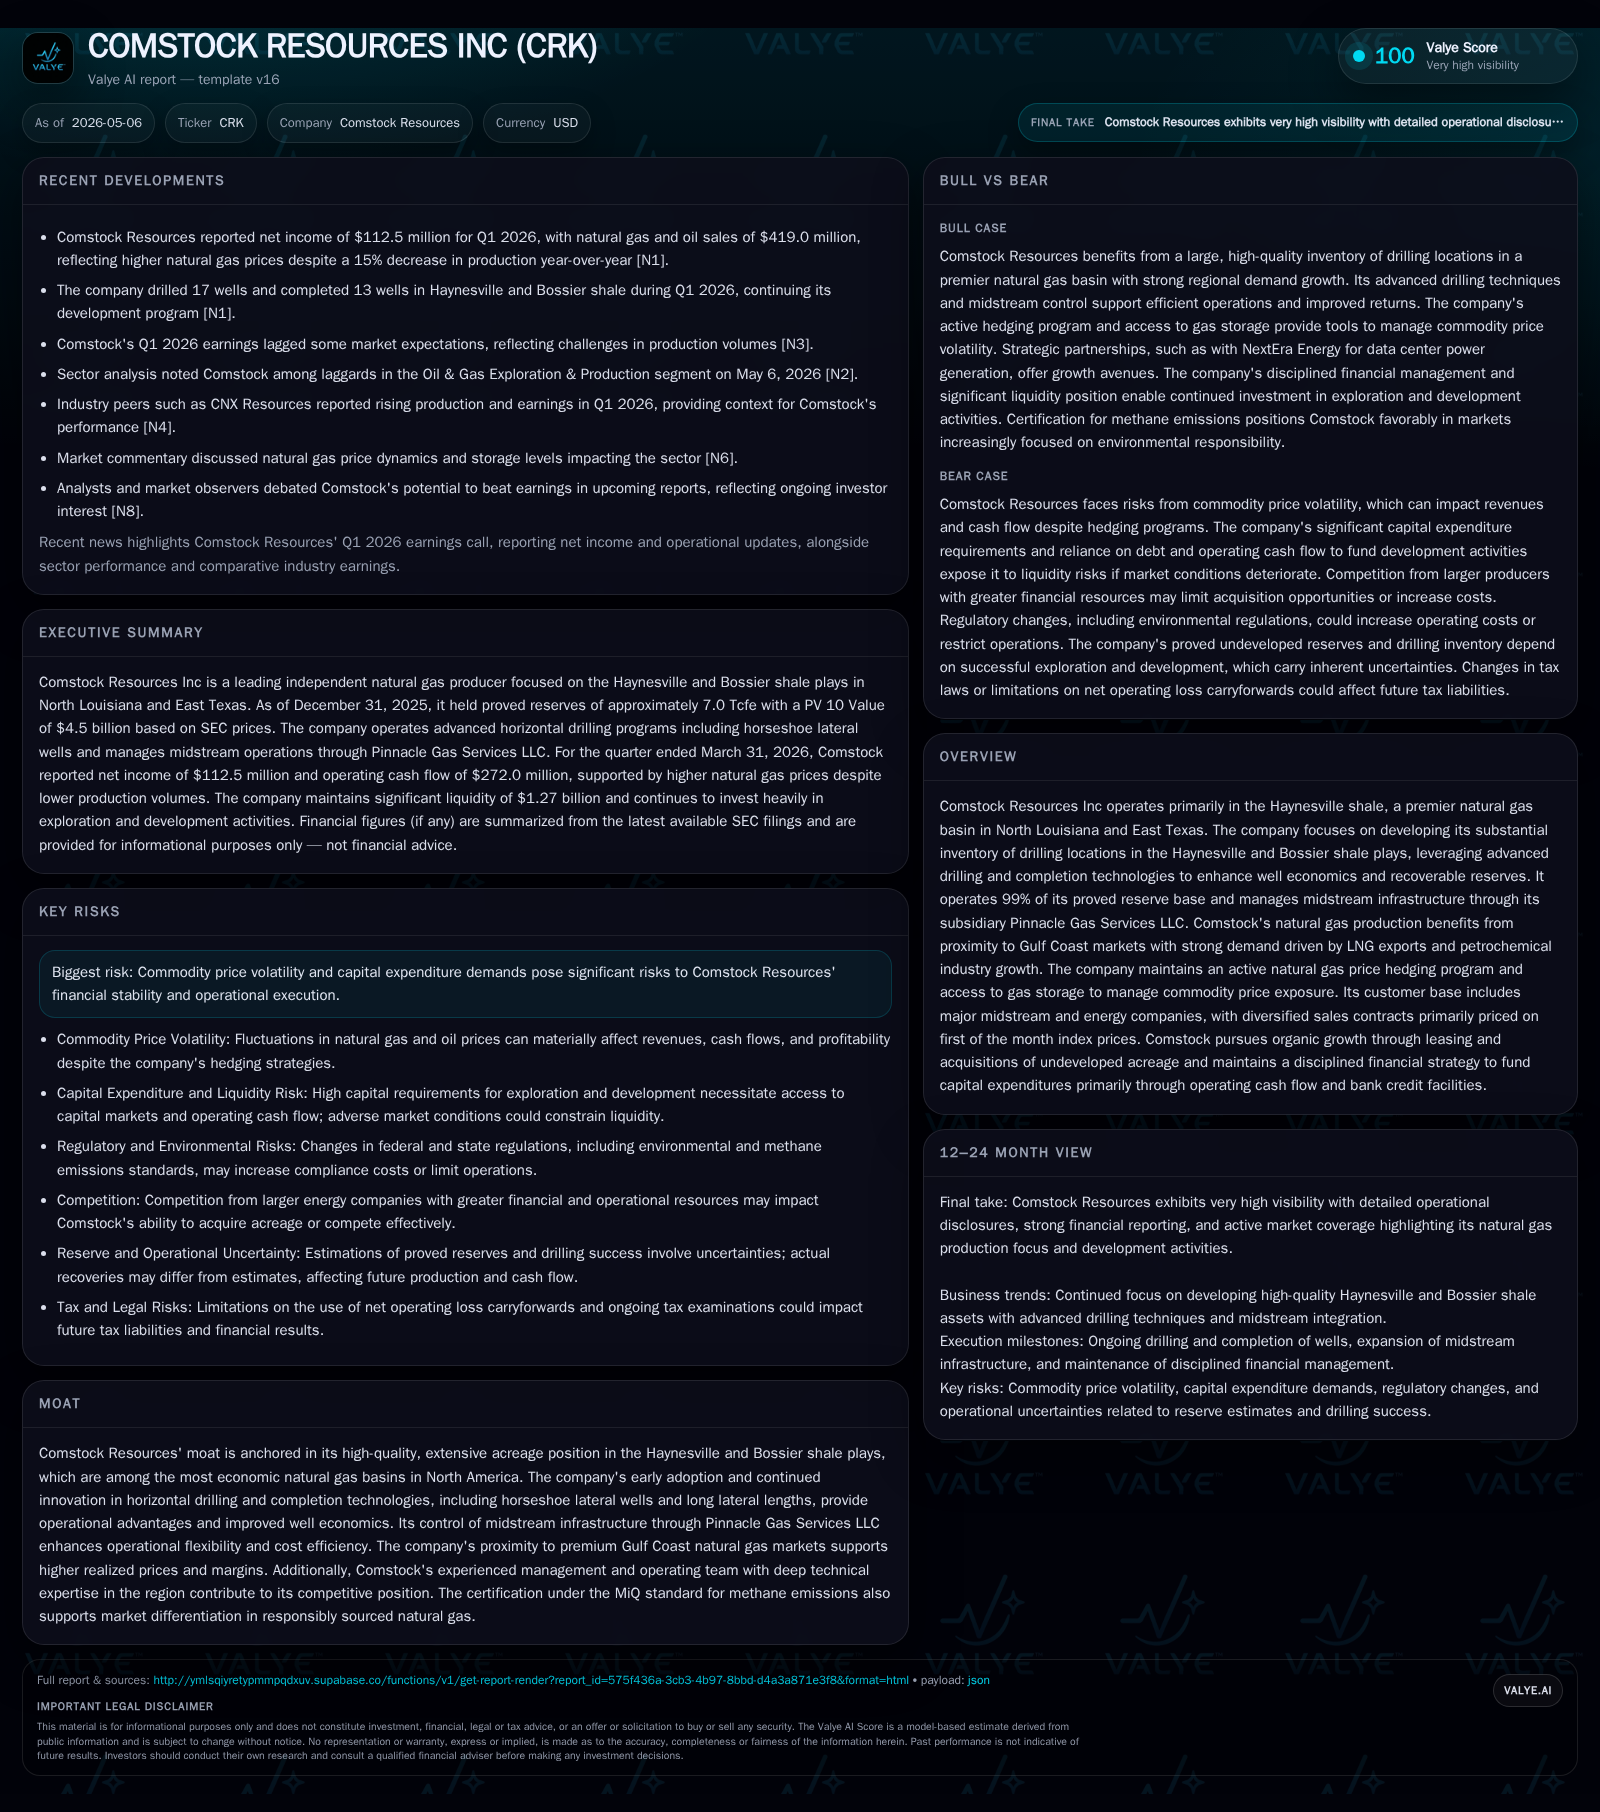
In Q1 2026, Comstock Resources executed 17 wells drilled and 13 completions in the Haynesville and Bossier plays, while natural gas production declined by 15% year-over-year. Despite volume contraction, realized natural gas prices rose 19%, supporting a modest revenue increase. The company plans $1.1 to $1.2 billion of additional capital expenditures for the rest of the year, emphasizing aggressive development and midstream infrastructure investment. Comstock’s integrated business model leveraging premium acreage and midstream assets underpins competitive advantages, though risks from commodity price volatility and capital intensity remain significant.
Q1 2026 Operating Update Signals Mixed Momentum
Comstock Resources’ latest quarterly report paints a nuanced picture of operational activity juxtaposed against ongoing challenges in production volumes. In the first quarter of 2026, the company drilled 17 wells (15.3 net) and completed 13 operated wells (11.7 net) focused exclusively in its core Haynesville and Bossier shale plays—demonstrating robust development throughput in one of North America’s most prolific gas basins [S2]. However, despite this drill-and-complete activity acceleration, natural gas production fell by 15% year-over-year to approximately 97.9 billion cubic feet (Bcf), or about 1.1 billion cubic feet per day (Bcf/d) [S2]. This suggests either deferred well tie-ins or maturation-driven declines of legacy inventory.
Counterbalancing these pressures on volume, Comstock realized an average natural gas price of $4.27 per thousand cubic feet (Mcf), up by nearly 19% compared to Q1 2025 [S2]. This price improvement translated into a modest revenue increase for natural gas and oil sales to $419 million—up about 1% over prior year despite the volume drop [S2]. A noteworthy contribution came from gas services revenues tied to marketing excess transport capacity which surged by roughly two-thirds to $166.5 million [S2].
On capital allocation, management revealed intent to invest aggressively with forecasted remaining capital expenditures between $1.1 billion and $1.2 billion through year-end focused on drilling, well completions, midstream infrastructure expansion, and other operational activities [S2]. Such a sizable capex commitment signals confidence in the Haynesville/Bossier play economics despite headwinds from decreasing near-term production.
Liquidity is another pillar supporting this strategy; as of March 31, 2026, Comstock held approximately $1.27 billion total liquidity—consisting predominantly of $1.15 billion undrawn bank credit facilities plus $14.8 million cash on hand—with some borrowing capacity earmarked for Pinnacle Gas Services midstream investments [S2]. The firm remained in compliance with financial covenants requiring leverage below 3.5x and an adjusted current ratio of at least 1.0x [S2], underscoring disciplined balance sheet management amid elevated spending.
Business Model Focused on Premium Haynesville Assets and Integrated Midstream Strategy
Comstock’s business centers on exploiting its extensive acreage position spanning roughly one million gross acres (over 800k net acres) in Haynesville/Bossier shale formations located primarily across North Louisiana and East Texas [S1]. These locations are notable as some of the most economic dry gas resource basins factoring geographic proximity to Gulf Coast demand hubs fueling growth in LNG export terminals and petrochemical complexes.
The company operates virtually all its proved reserve base (~7 Tcfe as of YE 2025) with an average reserve life approaching sixteen years—a rare longevity profile that incentivizes sustained investment [S1]. Moreover, Comstock controls critical midstream infrastructure through Pinnacle Gas Services LLC (PGS), enhancing margins via cost efficiency gains from capture-to-delivery logistics management along the value chain [S1].
Revenue is primarily generated from natural gas sales under a mix of indexing methodologies: roughly three-quarters priced off first-of-month indices coupled with spot market sales—particularly when new wells come online initially selling daily spot volumes [S1]. In addition to commodity sales, the business collects substantial gas services income related to transportation and storage offerings through PGS [S2]. This integrated model lessens reliance on pure commodity price exposure while reinforcing customer service value propositions.
Competitive Advantages in Shale Drilling Technologies and Gulf Coast Market Proximity
Technological innovation remains a crucial moat for Comstock Resources. The company has pioneered advanced horizontal drilling techniques featuring horseshoe lateral well designs combined with extended lateral lengths—technology that improves hydrocarbon recovery rates, well productivity metrics (EURs), and overall well economics [S1]. Further exploration upside exists notably in the Western Haynesville extension where early wells have delivered encouraging results relative to legacy fields.
Geographic proximity to premium Gulf Coast markets is another structural strength providing enhanced realized pricing compared to more isolated basins [S1]. Natural gas demand in these markets benefits from accelerating LNG export capacity expansions plus burgeoning petrochemical feedstock requirements linked to energy transition themes.
Control over midstream logistics via PGS allows flexible capacity management that optimizes throughput economics and delivers cost containment advantages relative to peers reliant on third-party systems [S1][S2]. This control also facilitates beneficial hedging strategies around both physical flows and financial derivative instruments employed by management.
Growth Drivers: Capital Expenditures, Technological Innovation, and Market Dynamics
Comstock’s runway for growth rests heavily on continued aggressive capital deployment paired with technology-enabled drilling excellence. The company maintains a rich drilling inventory enabling upper single-digit to low double-digit annual net well additions supported by long lateral lengths allowing large surface areas accessed per well [S2][S1].
Recent incremental investments focus not only on drilling new wells but also on infrastructure build-outs bolstering midstream capacity utilization while reducing per-unit costs—critical as volume growth moderates momentarily [S2]. Additionally, hedging programs targeting approximately three-quarters of production volume mitigate downside risk amidst spot market volatility.
Fundamentally supportive end-market trends underpin upside potential via sustained Gulf Coast regional demand fueled mainly by LNG exports which constitute a structural driver due to global clean energy shifts [S1]. Power generation load growth driven by data centers alongside petrochemical industry expansion further strengthens regional consumption profiles.
Risk Factors: Commodity Volatility, Production Declines, and Capital Intensity
Despite strengths, multiple risk vectors constrain near-term upside for Comstock Resources. First and foremost is commodity price volatility intrinsic to natural gas markets which causes variability in revenues and operating margins that can challenge capital discipline.
The latest quarter also revealed production volumes down meaningfully (-15%) even as capex ramps—highlighting execution challenges possibly related to well performance timing or hiatuses imposed by regulatory/environ issues such as Endangered Species Act protections detailed in annual filings [S1][N2]. Such declines increase unit cost pressures because fixed lease operating expenses spread over lower output raise per Mcfe charges.
Capital intensity remains high; expected full-year spending exceeding $2 billion underlines need for tight project management lest returns deteriorate amid lower commodity realizations or technical setbacks. Although liquidity provides a cushion currently ($1.27 billion including undrawn credit), covenant maintenance requires ongoing adherence given total debt levels hovering near $2.85 billion as of end-2025 [F1][S2].
Environmental regulations represent a further watchpoint given operational footprints intersecting habitat areas legally protected; mitigation expenses or delays could stifle project timelines or raise costs unexpectedly [S1].
Key Upcoming Catalysts and Operational Milestones
For observers tracking Comstock’s trajectory through remainder of calendar year 2026, several key markers merit attention:
- Production trends following completion volumes ramp: observing whether volume declines stabilize or reverse will clarify execution momentum given recent softening seen in Q1.
- Pace of quarterly capex spending vis-à-vis guidance range ($1.1-$1.2 billion) will indicate financial discipline alongside strategic spend priorities uncovered during earnings calls [N1][S2].
- Performance of hedging portfolio amid seasonal price swings affecting winter heating demand could materially affect cash flow predictability.
- Pinnacle Gas Services throughput volumes post-utilization adjustments may provide insights into margin stabilization prospects deriving from integrated approach.
- Regulatory developments impacting protected species areas will be critical given potential project timing impacts disclosed historically.
Collectively these indicators frame an evolving story balancing growth aspirations against operational realities within competitive delicacies inherent in Haynesville development.
Financial Snapshot: Liquidity, Leverage, and Capital Allocation
Latest financial snapshot
| Metric | Value | Period |
|---|---|---|
| Cash & equivalents | $15mm | |
| 2026-03-31 | ||
| Total debt | $2.8bn | |
| 2025-12-31 | ||
| Net debt | $2.8bn | |
| 2025-12-31 | ||
| Current assets | $290mm | |
| 2026-03-31 | ||
| Current liabilities | $712mm | |
| 2026-03-31 | ||
| Current ratio | 0.41x | |
| 2026-03-31 |
Source: SEC companyfacts cache [F1].
As of March 31st, Comstock demonstrated liquidity totaling approximately $1.27 billion derived mainly from unused bank credit facilities complemented by nominal cash balance—providing ample runway for capital expenditure ambitions while fulfilling short-term obligations comfortably [S2]. Total debt remained close to $2.85 billion based on year-end measurements with net debt adjusted accordingly given cash holdings [F1].
Management declared compliance with all financial covenants tied principally to leverage ratios below prescribed thresholds assuring no immediate refinancing concerns [S2].
This analysis leverages recent quarterly disclosures alongside annual context to evaluate Comstock Resources’ operational progress within its specialized niche in the North American natural gas sector without offering investment advice or forecasts beyond documented facts as of May 2026.
Disclaimer: This is research-only, informational analysis and not investment advice. It may include AI-generated interpretation and general industry context. Always verify important details using primary sources.
Comments