
Castor Maritime Inc. Shows Resilience Through Fleet Management and Asset Strategy Shifts
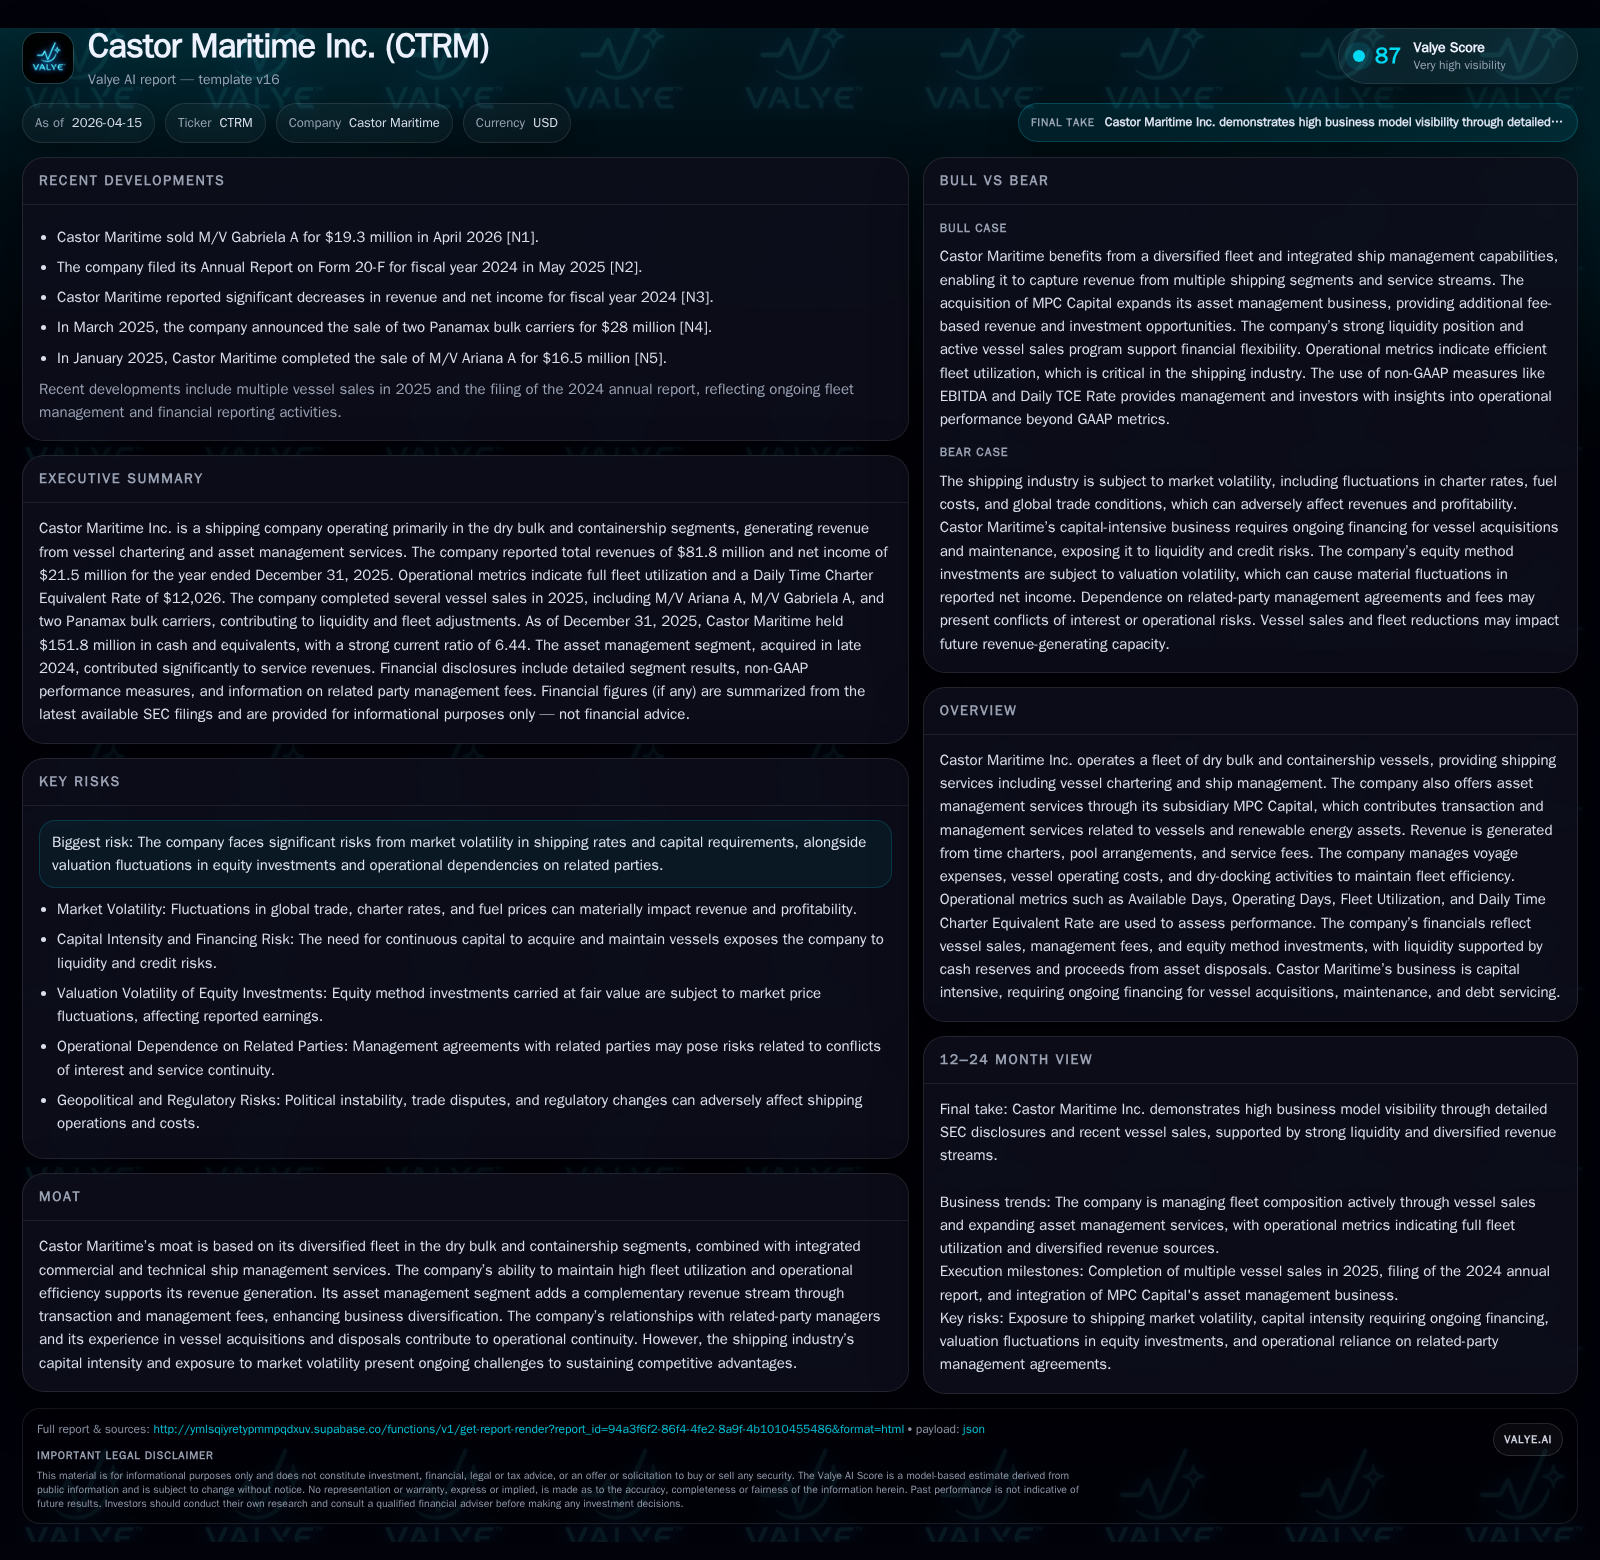
Castor Maritime leverages its diversified dry bulk and containership fleet alongside asset management services to stabilize revenues amid operational challenges and market volatility.
Castor Maritime Inc. has sustained revenue growth through a dual business model integrating shipping operations and asset management. Despite a notable rise in top-line revenue by 23.5% in 2025, operating income dipped into negative territory due to increased voyage expenses and off-hire periods. The company’s fleet utilization, combined with transaction fees via MPC Capital, supports diversified income streams that mitigate sector cyclicality. Castor’s liquidity remains robust with over $150 million in cash at year-end 2025, while strategic debt repayments and sale-leaseback arrangements reflect active capital structure management. Investors should monitor dry docking schedules, vessel sales, and charter rate trends as near-term catalysts influencing operational performance.
Historical Growth Drivers: Fleet Expansion, Charter Rates, and Service Integration
Historical performance (annual)
| FY | Rev ($mm) | Net ($mm) | OpInc ($mm) | Capex ($mm) | Rev YoY | Net YoY |
|---|---|---|---|---|---|---|
| 2025 | 82 | 19 | -18 | +23.5% | +31.8% | |
| 2024 | 66 | 15 | 21 | 72 | -32.1% | -62.2% |
| 2023 | 98 | 39 | 22 | 1 | -62.8% | -67.4% |
| 2022 | 262 | 119 | 127 | 76 |
Source: SEC companyfacts cache [F1].
Capital returns and efficiency (annual)
| FY | ROE% |
|---|---|
| 2025 | 3.7 |
| 2024 | 3.0 |
| 2023 | 8.4 |
| 2022 | 25.7 |
Source: SEC companyfacts cache [F1].
Castor Maritime's financial results over recent years have reflected the cyclical nature of the shipping industry combined with strategic fleet management. Revenue peaked at $262.1 million in FY2022 driven by favorable dry bulk charter rates but contracted to $97.5 million in FY2023 before rebounding to $66.2 million in FY2024 and increasing further to $81.8 million in FY2025 ([F1]). This trajectory aligns with the company's efforts to expand its fleet across dry bulk carriers and containerships while integrating commercial and technical ship management services for optimized utilization.
Time charter agreements provide revenue stability complemented by pooling arrangements that distribute operational risks [S1]. These mechanisms help moderate voyage expense volatility while maintaining earnings linked closely to charter-free market values.
2025 Financial Performance: Revenue Growth Amid Operating Income Pressure
In FY2025, Castor reported a 23.5% increase in revenue year-over-year to $81.8 million; however, operating income declined significantly from $21.4 million positive in FY2024 to a loss of $18.4 million ([F1]). The operating margin contraction was primarily due to higher voyage expenses including bunker fuel costs during repositioning voyages or commercial waiting periods, increased dry-docking expenditures mandated by regulatory requirements, and extended vessel off-hire days for maintenance or refurbishment [S1][N1].
Despite operating losses, net income remained positive at $19.3 million supported by non-operating gains such as proceeds from the sale of vessels like M/V Gabriela A for approximately $19.3 million [N1][F1]. This reflects Castor's active asset rotation strategy partially offsetting operational cost pressures.
Fleet Composition and Operational Efficiencies
The company's diversified fleet across dry bulk and containership segments underpins resilience amid shifting demand patterns [S1]. Key operational metrics include Available Days (total calendar days vessels are available for employment), Operating Days (actual days earning charter hire excluding off-hires), Fleet Utilization Rate (operating days divided by available days), and Daily Time Charter Equivalent (TCE) Rate which normalizes voyage revenues net of expenses over operating days.
This mixed fleet serves commodity transport via dry bulk vessels and containerized trade through containerships [S1]. Maintaining high utilization combined with disciplined technical maintenance supports stable TCE rates essential for margin preservation.
Asset Management Segment: Diversification Through MPC Capital
Through its subsidiary MPC Capital, Castor extends beyond shipping operations into asset management including vessel transactions and renewable energy assets [S2]. Revenue streams comprise success-based transaction fees tied to deal closures alongside recurring service fees for ongoing asset management.
This diversified business model reduces dependence on volatile freight markets [S2]. Initiatives such as the BestShip joint venture enhance sustainability services offering IT-based vessel energy efficiency assessments aligned with emerging maritime environmental regulations [S17].
Market Risks and Asset Valuation Volatility
The capital-intensive shipping sector remains exposed to global trade fluctuations influenced by geopolitical tensions, tariffs, inflationary trends, and commodity demand shifts [S20]. Castor's reliance on related-party managers necessitates vigilant oversight.
Vessel valuations are subject to volatility; as of December 31, 2025, all vessels except M/V Magic Celeste had carrying values exceeding charter-free market estimates ([S1]), though impairment risk persists should market conditions deteriorate rapidly.
Debt Profile and Liquidity Position
At year-end 2025, Castor's gross indebtedness stood at approximately $85.6 million comprising senior secured term loans backed by first-priority mortgages on vessels plus pledged earnings accounts and insurance assignments [F1]. Loan maturities are staggered with scheduled quarterly installments plus balloon payments.
Debt agreements include customary covenants such as minimum liquidity balances (e.g., maintaining at least $500K free cash per vessel), leverage caps near 70%, mandatory dry-dock reserve accounts for upcoming overhauls, and security coverage ratios based on collateral values [S4][S9][S10].
Cash reserves increased substantially from $87.9 million at the end of 2024 to $151.8 million at year-end 2025 reflecting vessel sale proceeds combined with operational cash flow generation [F1][S11]. This results in a strong current ratio of approximately 6.44 indicating solid short-term liquidity.
Capital Allocation: Dividends, Capex & Buybacks
No dividends were declared on common shares during FY2025; however preferred share dividends totaling around $4.9 million were paid to Toro Investments consistent with obligations under Series D Preferred Shares [S16][S24].
Capital expenditures surged sharply in FY2024 ($72.2 million) associated with fleet expansion but normalized markedly in FY2025 ($0.6 million) signaling a shift towards consolidation after prior investment phases [F1][S23].
While no formal share buyback program was noted during this period, capital recycling through selective vessel sales combined with sale-leaseback arrangements provides financial flexibility without materially reducing fleet capacity [S15].
Outlook: Key Considerations for Investors
Management has not provided explicit forward guidance or precise fleet acquisition targets post-2025 [N1][S2], making monitoring key indicators critical:
- Dry docking schedules impacting off-hire days and short-term revenues.
- Vessel sale or acquisition announcements such as recent M/V Gabriela A disposition [N1].
- Changes or redemptions relating to preferred shares potentially affecting leverage or dividend obligations ([S16]).
- Quarterly updates clarifying recovery prospects amid variable bunker fuel costs.
- Progress within MPC Capital’s asset transaction pipeline including renewables-focused ventures enhancing diversification [S17][S23]. These factors will be instrumental in assessing operational efficiency improvements and capital deployment strategies driving shareholder value.
This analysis is based exclusively on financial data from Castor Maritime Inc.’s SEC filings as of April 15, 2026 ([F1],[S1]-[S28]) supplemented by relevant news sources ([N1]). It refrains from speculative forecasts unsupported by company disclosures. Readers should consider the cyclical nature of shipping alongside company-specific disclosures when evaluating future performance potential.
Disclaimer: This is research-only, informational analysis and not investment advice. It may include AI-generated interpretation and general industry context. Always verify important details using primary sources.
Comments