
California Water Service Group Faces Regulatory Headwinds and Operational Shifts in 2025
Steep declines in Cal Water’s earnings in 2025 contrast with strategic expansion amid liquidity constraints and regulatory complexities.
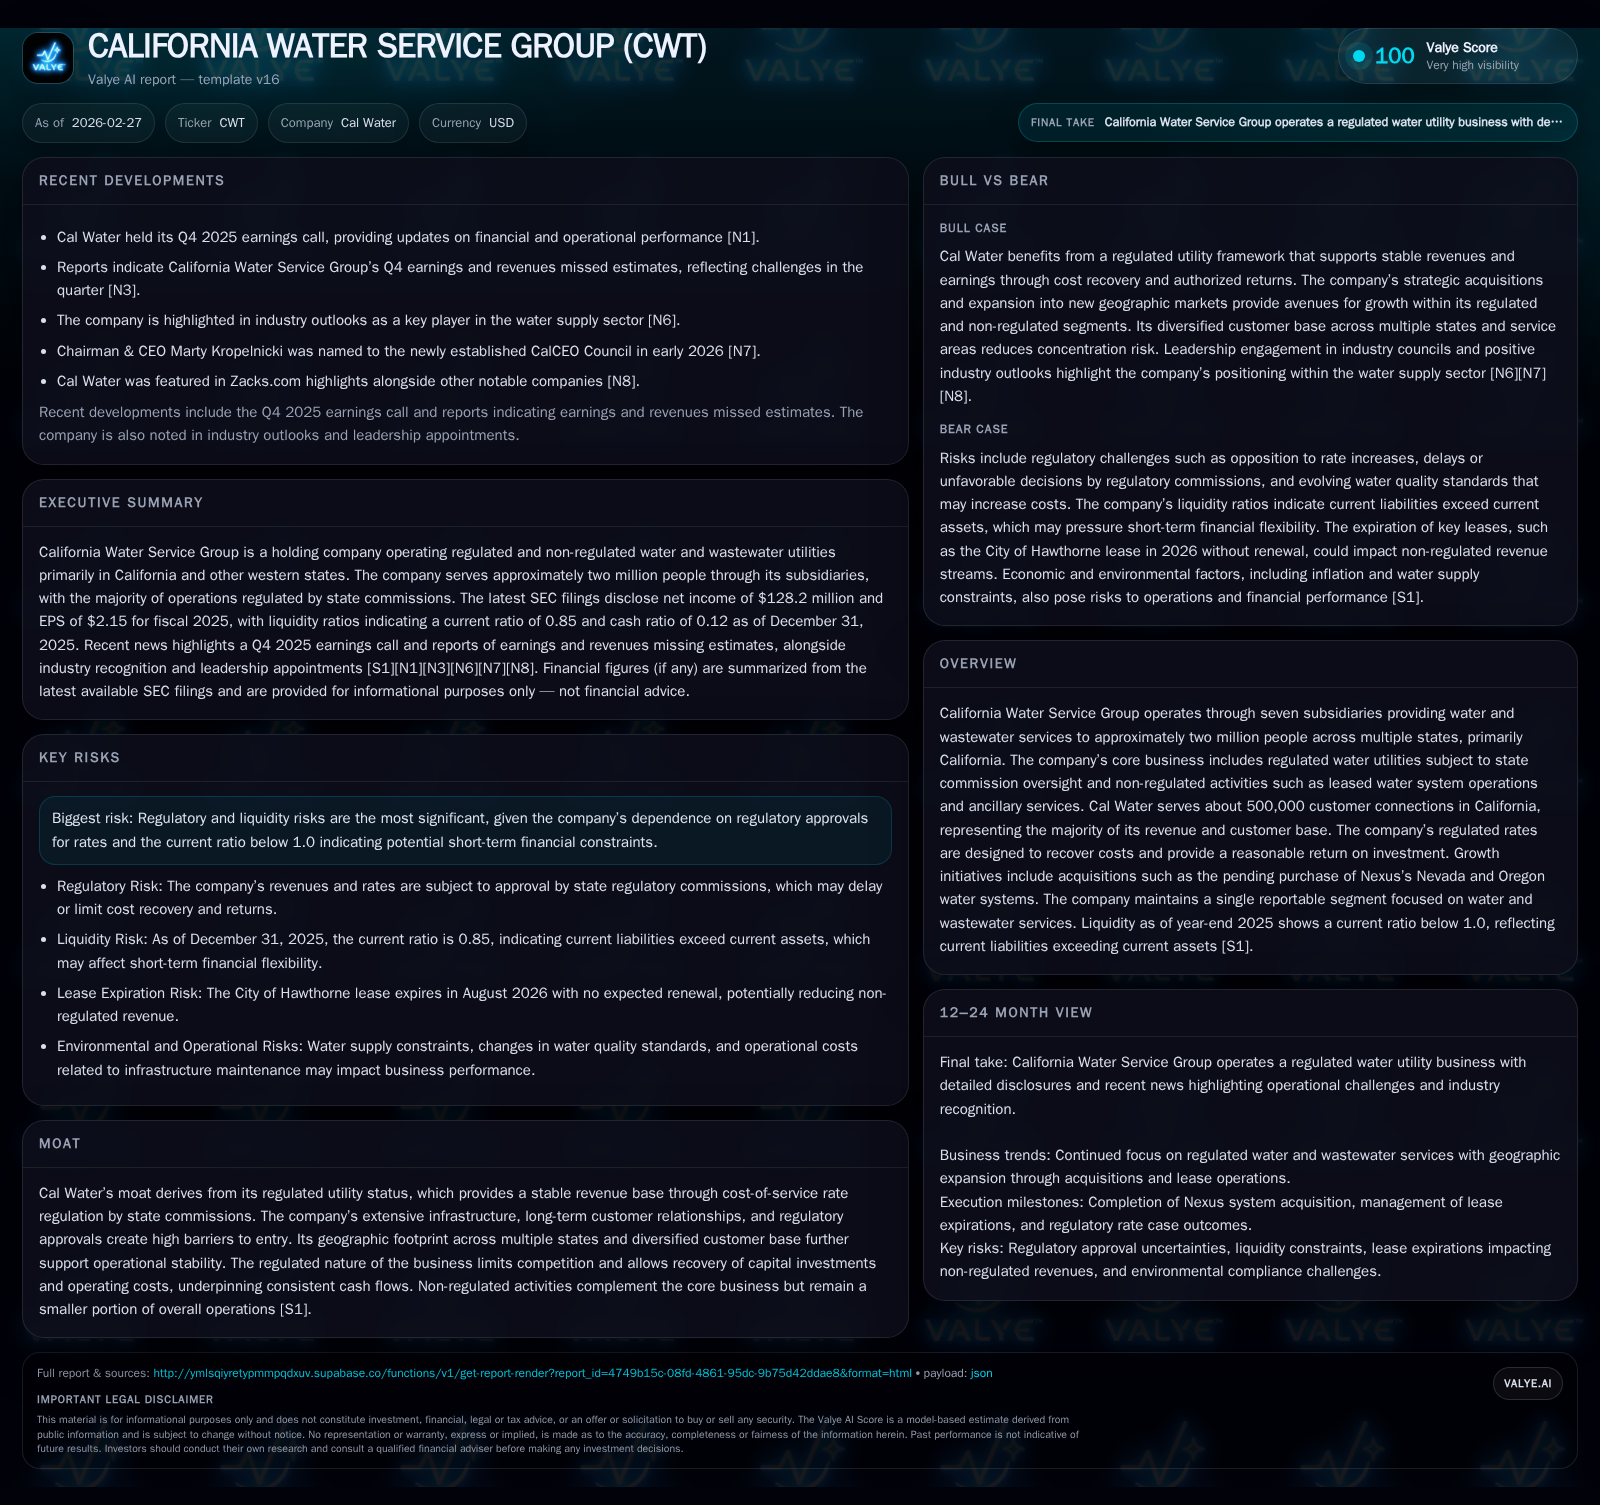
California Water Service Group reported a notable year-over-year drop in operating income (-24.3%) and net income (-32.8%) for fiscal 2025 despite a solid increase in operating cash flow (+4%) and a significant capex ramp (+19.3%). As a primarily regulated utility serving roughly two million people, Cal Water’s stable revenue model faces increasing pressure from regulatory rate cases and rising infrastructure investments. The company pursues growth through acquisitions including pending purchases of Nexus systems, but current liquidity challenges, reflected by a sub-1.0 current ratio, underscore capital structure vulnerabilities. Going forward, regulatory approvals and effective cash flow management will be critical to balancing expansion ambitions and financial stability.
Earnings and Operating Income: Understanding the 2025 Decline
California Water Service Group exhibited a stark reversal in profitability trends during fiscal year 2025. Operating income dropped by nearly one-quarter (-24.3%) year over year to $170 million [F1], sharply contrasting with prior years where gains were observed (from $77 million in 2023 to $225 million in 2024). Net income followed suit, plunging by almost one-third (-32.8%) to $128 million [F1]. This decline ostensibly stems from increased operating costs and higher depreciation linked to an expanding asset base.
Interestingly, the company’s operating cash flow demonstrated resilience by rising 4% to about $303 million [F1]. This divergence between stronger cash flows and weaker accounting earnings suggests non-cash items like depreciation related to augmented capex influenced net results.
Capital expenditures surged by approximately 19.3% to $68 million as Cal Water invested heavily in infrastructure upgrades and expansions across its regulated districts [F1]. Such elevated capex outlays likely weighed on short-term profitability as these costs contribute incrementally to expenses before full rate recovery through regulatory channels.
Historical performance (annual)
| FY | Net ($mm) | CFO ($mm) | OpInc ($mm) | Capex ($mm) | Net YoY |
|---|---|---|---|---|---|
| 2025 | 128 | 303 | 170 | 68 | -32.8% |
| 2024 | 191 | 291 | 225 | 57 | +267.6% |
| 2023 | 52 | 218 | 77 | 54 | -45.9% |
| 2022 | 96 | 244 | 128 | 52 |
Source: SEC companyfacts cache [F1].
Capital returns and efficiency (annual)
| FY | Div ($mm) | Buybacks ($mm) | FCF ($mm) |
|---|---|---|---|
| 2025 | 74 | 1 | 235 |
| 2024 | 65 | 1 | 234 |
| 2023 | 59 | 2 | 163 |
| 2022 | 54 | 2 | 192 |
Source: SEC companyfacts cache [F1].
Note: All dollar amounts are USD millions.
Regulated Water Utility Model: Stability Meets Headwinds
Cal Water’s foundational moat lies in its operation as a regulated water utility subject primarily to cost-of-service ratemaking overseen by state commissions such as California’s Public Utilities Commission (CPUC). This regulatory construct guarantees that rates are set to recover allowed operating expenses plus provide an authorized return on the rate base — essentially the invested capital in plant and infrastructure [S1][S15].
While this model underpins revenue stability and predictable cash flows uncommon in unregulated businesses, it also engenders sensitivity around the timing and outcome of rate case approvals that directly influence earnings volatility.
The company's efforts to diversify via non-regulated water system leases (e.g., City of Hawthorne and Commerce contracts) and ancillary services contribute marginally yet remain governed by revenue-sharing arrangements that limit upside [S4].
Thus, regulatory risk remains prominent; delays or denials in rate relief can compress margins as operating costs rise due to inflation or mandated infrastructure upgrades, such as those driven by escalating water quality standards or wildfire mitigation obligations affecting utility operations [S15][S21].
Geographic and Segment Overview with Customer Connections
Cal Water provides service predominantly across California with its largest regulated subsidiary serving approximately half a million customer connections which represent nearly nine-tenths of total connections and over ninety percent of consolidated revenue [S6][S14][F1]. The company operates through multiple regions:
- San Francisco Bay Area/North Coast: ~113k connections
- Sacramento Valley: ~45k connections
- Salinas Valley: ~32k connections
- San Joaquin Valley: ~181k connections
- Los Angeles Area: ~122k connections including leased municipal systems in Hawthorne/Commerce [S6]
Outside California, subsidiaries provide smaller yet meaningful footprints:
- Washington (~38k customers)
- New Mexico (~12k customers)
- Hawaii (~7k customers)
- Texas via BVRT (~5k customers), fully acquired late in FY25 subject to regulatory filing [S14][S20]
The company’s pending acquisition of Nexus-water systems will add about 36,000 equivalent residential connections mainly across Nevada and Oregon with an estimated combined rate base of approximately $109 million expanding geographic diversification beyond California [N1][S20].
Growth Strategies: Expanding Through Acquisitions and New Contracts
Cal Water outlines clear ambition toward growth through strategic acquisitions and service expansions across the western U.S., leveraging its regulated status as an entry barrier while pursuing complementary non-regulated opportunities [S4][N1]. Key moves include:
- The $218 million agreement announced in early 2026 to acquire Nexus’s Nevada/Oregon water/wastewater systems with closing expected by end-2026 subject to approvals.
- Operational leases managing municipal water systems like Hawthorne (expiring Aug’26) and Commerce augment fee-based revenue streams.
- The latest completion of Texas Water's acquisition of remaining BVRT interests broadens access into Texas markets pending commission approval.
These steps aim at bolstering overall customer base and regulated rate base growth—key drivers for future allowable earnings increases under cost-based ratemaking frameworks. However, integration complexity coupled with the inherent timing uncertainty around rate case decisions impose growth execution risk [N1][S15].
Liquidity Status, Debt Profile, and Capital Structure Risks
Despite underlying cash flow strength, Cal Water faces palpable short-term liquidity constraints as reflected by its current ratio standing near only approximately 0.85 at year-end FY25 ([current assets of $354M versus current liabilities of $418M]) [F1]. Such a ratio underlines reliance on accessing longer-term financing sources or asset sales for working capital needs. The company carries substantial long-term debt evidenced through senior unsecured notes maturing mostly between the early-to-mid-2030s along with secured bonds; diligent refinancing strategy will remain essential given fluctuating credit market conditions [S5][S7]. Management signals awareness of these pressures compounded by covenants imposing limitations on debt levels or dividends illustrated through stated risk disclosures centered on restrictive credit terms potentially elevating financing costs or limiting operational flexibility during adverse cycles [S15][S29].
Capital Allocation Priorities: Dividends, Buybacks, and Capex Trends
Historically consistent dividend growth illustrates Cal Water's commitment to steady shareholder returns even amid earnings headwinds: dividend payouts rose from $54 million in FY22 to nearly $74 million paid out in FY25 [+~37%] [F1]. Conversely, share repurchases remain minimal (<$2 million annually), spotlighting limited use of buybacks within capital return strategy likely influenced by liquidity prudence. Capital expenditure has risen markedly year over year reaching nearly $68 million last fiscal year—supporting both system renewal amid aging infrastructure plus expansion-related projects aligned with growth ventures such as Nexus acquisition preparations [F1][S22]. Calculated approximate return on equity at roughly 13.9% signals reasonable capital profitability supporting reinvestments alongside payouts. Free cash flow after capex emerges healthy at ~$235 million but bears watching relative to funding obligations especially if acquisitions accelerate [F1].
Looking Ahead: What to Watch for Beyond Fiscal 2025
Analysts should monitor key milestones shaping Cal Water's trajectory:
- Closure of Nexus acquisition along with requisite state regulatory approvals affecting timing of associated revenue recognition and rate integration [N1].
- Outcomes from CPUC and other commissions’ pending general rate cases across core California districts which will determine future allowed returns amid elevated investment needs.
- Liquidity management signals via quarterly updates focusing on cash balances relative to near-term debt maturities given current ratio challenges.
- Management commentary from upcoming earnings calls offering insights into operational impacts from environmental mandates such as PFAS regulations recently finalized at federal levels but still legally contested impacting compliance costs [N1][S15][S23].
- Success or setbacks integrating non-regulated contracts similarly affecting margin profiles.
Forecasting beyond these factors relies heavily on evolving regulatory landscapes alongside macroeconomic drivers influencing construction costs, interest rates, and water demand patterns—core considerations for this capital-intensive utility sector.
This analysis summarizes California Water Service Group based solely on publicly filed financial reports and verified news transcripts as of early calendar year 2026 without providing investment recommendations or price forecasts.
Disclaimer: This is research-only, informational analysis and not investment advice. It may include AI-generated interpretation and general industry context. Always verify important details using primary sources.
Comments