
Caesars Entertainment’s Growth Rides Digital Expansion Amid Rising Costs and Leverage
Strong revenue growth in 2025 was driven by digital gaming and new properties, offset by rising expenses and a loss at net income level.
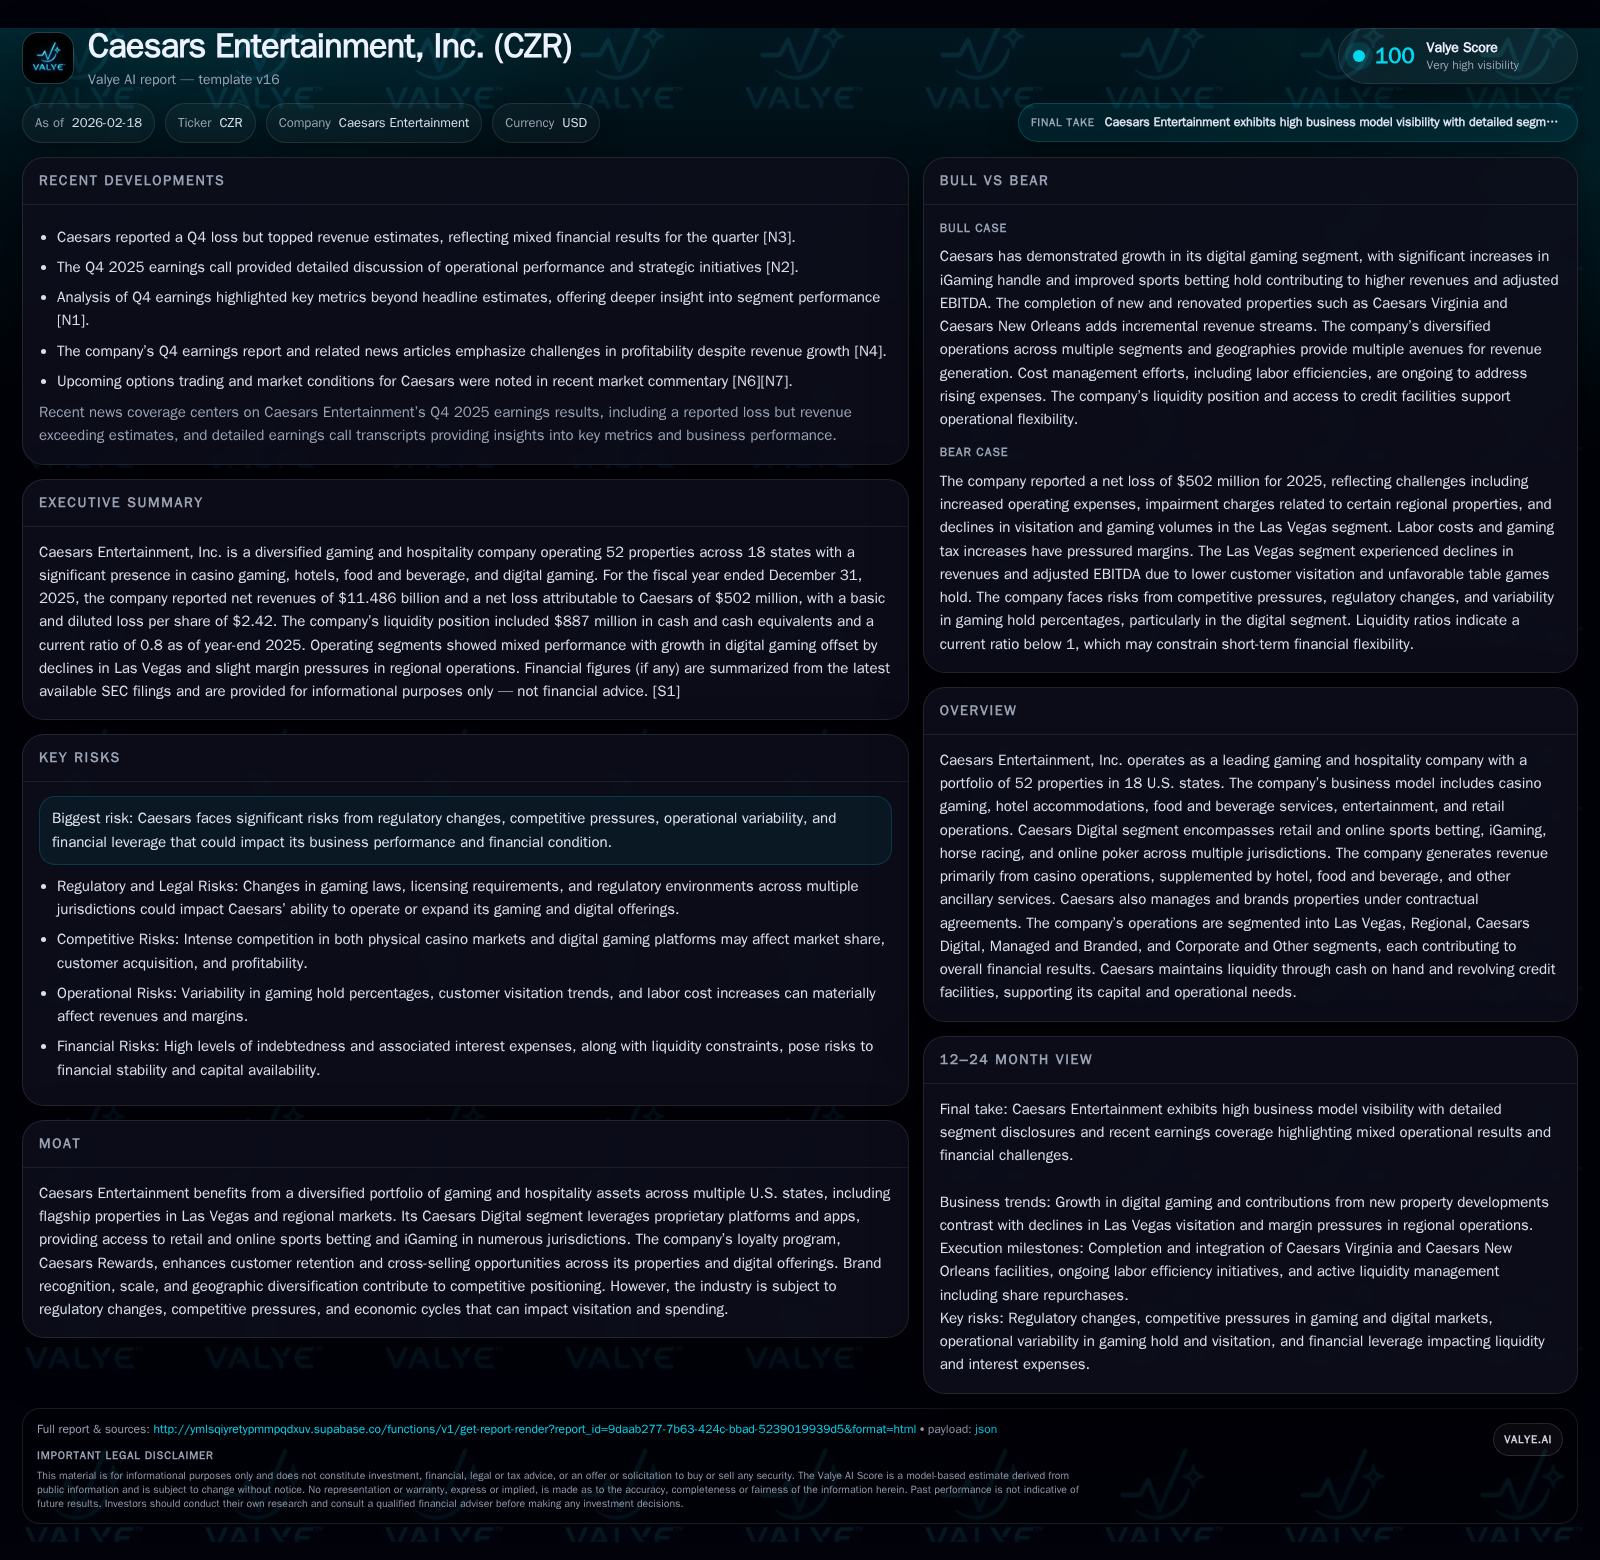
Caesars Entertainment demonstrated top-line resilience in 2025 with a 2.1% revenue increase to $11.5 billion—led primarily by strong gains in its Caesars Digital segment and new property openings. Operating income, however, declined 19% due to higher operating expenses, increased gaming taxes, and impairment charges linked to competitive pressures in regional markets. While operating cash flow surged over 300%, net losses deepened to $502 million, reflecting elevated non-operating costs and the impact of financial leverage. The company continues to invest heavily in capital expenditures yet maintains liquidity supported by sizable revolver capacity and disciplined buybacks under a $500 million repurchase program.
Company Overview
Caesars Entertainment, Inc. operates as a major player in the U.S. gaming and hospitality industry with a diversified portfolio encompassing 52 properties across 18 states. Their operations span casino gaming, hotel accommodations, food & beverage services, entertainment, retail operations, and the Caesars Digital segment that includes online sports betting, iGaming, horse racing, and poker platforms. The business enjoys strong brand equity through its Caesars Rewards loyalty program which drives cross-channel customer engagement.
Historical Performance
In 2025, Caesars reported consolidated net revenues of approximately $11.49 billion—an increase of about 2.1% over $11.25 billion recorded in 2024 [S1][F1]. This growth was primarily fueled by notable expansion within Caesars Digital due to increased iGaming handle and better hold percentages for sports betting. Incremental revenues were also contributed by the opening of the permanent facility in Caesars Virginia (completed December 2024) as well as renovations and expansions of Caesars New Orleans (October 2024). However, these were partially offset by declines in certain competitive regional markets and reduced visitation trends in Las Vegas.
Despite revenue gains, operating income dropped steeply by roughly 19% to $1.86 billion in 2025 from $2.3 billion a year earlier [F1]. Higher operating expenses accounted for this decrease:
- Casino expenses rose by nearly 7%, driven by increased gaming taxes (reflecting mid-2025 hikes on sports betting/iGaming) plus platform costs associated with digital expansion.
- Food & beverage and hotel expenses increased due to higher union/non-union wages correlating with expanded operations at new facilities.
- General administrative costs edged up slightly while impairment charges decreased relative to prior periods but remained material.
- Depreciation/amortization rose due to completed construction projects.
The net result was a loss of $502 million for the full year versus a smaller loss of $278 million in 2024 despite higher EBITDA-level profitability [F1]. Financial costs (interest expense mostly tied to heavy leverage), roughly around $700 million annually given the large debt load nearing $12 billion (including VICI leases), weighed heavily on bottom-line results.
Historical performance (annual)
| FY | Net ($mm) | OpInc ($bn) | Capex ($mm) | Net YoY |
|---|---|---|---|---|
| 2025 | -502 | 1.9 | 805 | -80.6% |
| 2024 | -278 | 2.3 | 1296 | -135.4% |
| 2023 | 786 | 2.5 | 1264 | +187.4% |
| 2022 | -899 | 1.7 | 952 |
Note: Omitted columns lack sufficient annual XBRL coverage in the provided tags (need ≥2 annual points): Rev, CFO, Div, FCF. Source: SEC companyfacts cache [F1].
Capital returns and efficiency (annual)
| FY | Buybacks ($mm) | ROE% |
|---|---|---|
| 2025 | 229 | -14.3 |
| 2024 | 191 | -6.7 |
| 2023 | 17.3 | |
| 2022 | -24.2 |
Source: SEC companyfacts cache [F1].
*Some metrics omitted due to insufficient data.
Future Growth Prospects
Caesars aims to capitalize on its multi-state digital footprint as online gaming continues penetrating U.S markets where regulation permits access. The company’s proprietary digital platforms—leveraged for both retail sportsbooks and online iGaming—are significant drivers of incremental revenue highlighted during the recent fiscal year [S1]. Continued market share gains here could support top-line growth even if traditional brick-and-mortar visitation faces pressure.
Additionally, ongoing investments in physical assets like Caesars Virginia's permanent facility and property renovations signal confidence in regional market recovery potential post-pandemic disruptions [S1]. However, competition within certain regional segments contributed to impairments for expected future cash flows during the year—a cautionary indicator regarding some market saturation or demand softness [S1].
Labor cost inflation remains a notable cost headwind impacting margins given the sector's historically labor-intensive operations (gaming floor staff, hospitality workers). Furthermore, regulatory risks persist with recent increases in gaming tax rates on digital wagers effective July 2025 likely dampening potential profit expansion on those units [S15]. Cybersecurity litigation from a data breach incident also poses contingent liability risks that could incur additional costs or settlements affecting future earnings stability [S15].
Future catalysts hinge on successful integration of digital growth with physical expansion while managing operational expense pressures amid evolving regulatory landscapes.
Forecasts & Milestones
No explicit numeric guidance was provided for upcoming periods during the latest earnings disclosures [N2][N3][S3]. Key milestones to track include:
- Quarterly performances of Caesars Digital segment as an indicator of online gaming traction increments.
- Operating efficiency improvements or margin stabilization efforts related to wage inflation.
- Repurchase program activity levels alongside incremental debt paydown tendencies.
- Impairment charge developments which could foreshadow underlying asset value adjustments. Analysis suggests close monitoring of free cash flow generation vis-à-vis continuing capital expenditure needs (~$0.8bn estimated for FY25) crucial for assessing sustainable capital returns prospects.
Returns & Capital Allocation
Caesars’ return profile is challenged currently by net losses; approximate ROE based on last fiscal year-end equity ($3.504 billion) yields negative ~14% return reflecting depressed bottom-line results amid leveraged balance sheet dynamics [F1]. Cash flow from operations rebound was robust at $1.3 billion (+316% vs prior year), supporting liquidity despite capex outlays compressing free cash flow generation which totaled an estimated $497 million (operating cash flow minus capex) for FY25.
Capital allocation prioritized shareholder returns via share repurchases totaling $229 million during FY25 under an open-ended $500 million authorization launched October 2024 that still retains approx. $221 million remaining capacity as of year-end [S13][S22]. No dividend distributions are disclosed within available filings/citations.
Debt management included redemption of ~$546 million senior notes due in mid-2027 using revolver borrowings combined with proceeds from asset sales related to WSOP trademark rights—a move indicating focus on liability profile optimization albeit leaving substantial long-term debt >$11 billion outstanding with maturities spanning into early next decade [S19][S22][S26].
In sum, shareholder cash returns rely heavily on buybacks financed through operational cash flow while dividends remain absent; effective debt service coverage ratios observed remain compliant across multiple covenant frameworks though leverage metrics warrant diligent scrutiny going forward especially given sensitivity analyses indicating ~$61 million annual cost increase per 100bps rise in interest rates [S19][S20][F1].
Industry Context & Specifics
The gaming sector continues evolving rapidly as online platforms gain favor among consumers preferring digital sports betting and casino games accessible via mobile devices—a structural shift Caesars embraces through its proprietary apps heightening competition against both legacy operators expanding digitally and newer pure-play entrants.
Labor cost inflation across hospitality segments remains acute nationwide as tight job markets drive wage demands upward; efficiency improvements are critical but difficult given simultaneous elevation in service standards required.
Leases underpinning much real estate exposure (notably VICI Properties triple-net leases totaling ~$11.7 billion financing obligations at Dec ‘25) create fixed cost burdens sensitive to consumer spending volatility especially considering CPI escalations embedded within lease agreements.
Conclusion
Caesars Entertainment delivered modest revenue growth powered chiefly by strategic digital channels and property enhancements but contended with margin compression driven by escalating operational costs including higher taxes post regulatory changes and competitive market-induced impairments in select regions. A substantial jump in operating cash flow bolsters liquidity enabling solid buyback programs; however, net losses persist exacerbated by considerable debt service burdens reflective of leveraged capital structure largely secured against marquee properties leased from REITs such as VICI.
Management’s path ahead involves balancing investment into growth initiatives like iGaming expansion with cost containment amidst challenging macroeconomic labor conditions alongside carefully calibrated capital allocation aimed at debt reduction without sacrificing shareholder returns via repurchases.
Investors will want to monitor quarterly updates for progress on digital revenue traction, margin stabilization efforts particularly related to labor expenses and tax impacts, along with free cash flow trends relative to ongoing capital expenditure commitments that underpin property modernization strategies.
Disclaimer: This is research-only, informational analysis and not investment advice. It may include AI-generated interpretation and general industry context. Always verify important details using primary sources.
Comments