
Dave Inc.'s Surging Profitability and Its Road to Sustainable Growth
Dave Inc. leverages proprietary AI underwriting and enhanced digital banking to fuel robust revenue growth and profitability amid evolving regulatory challenges.
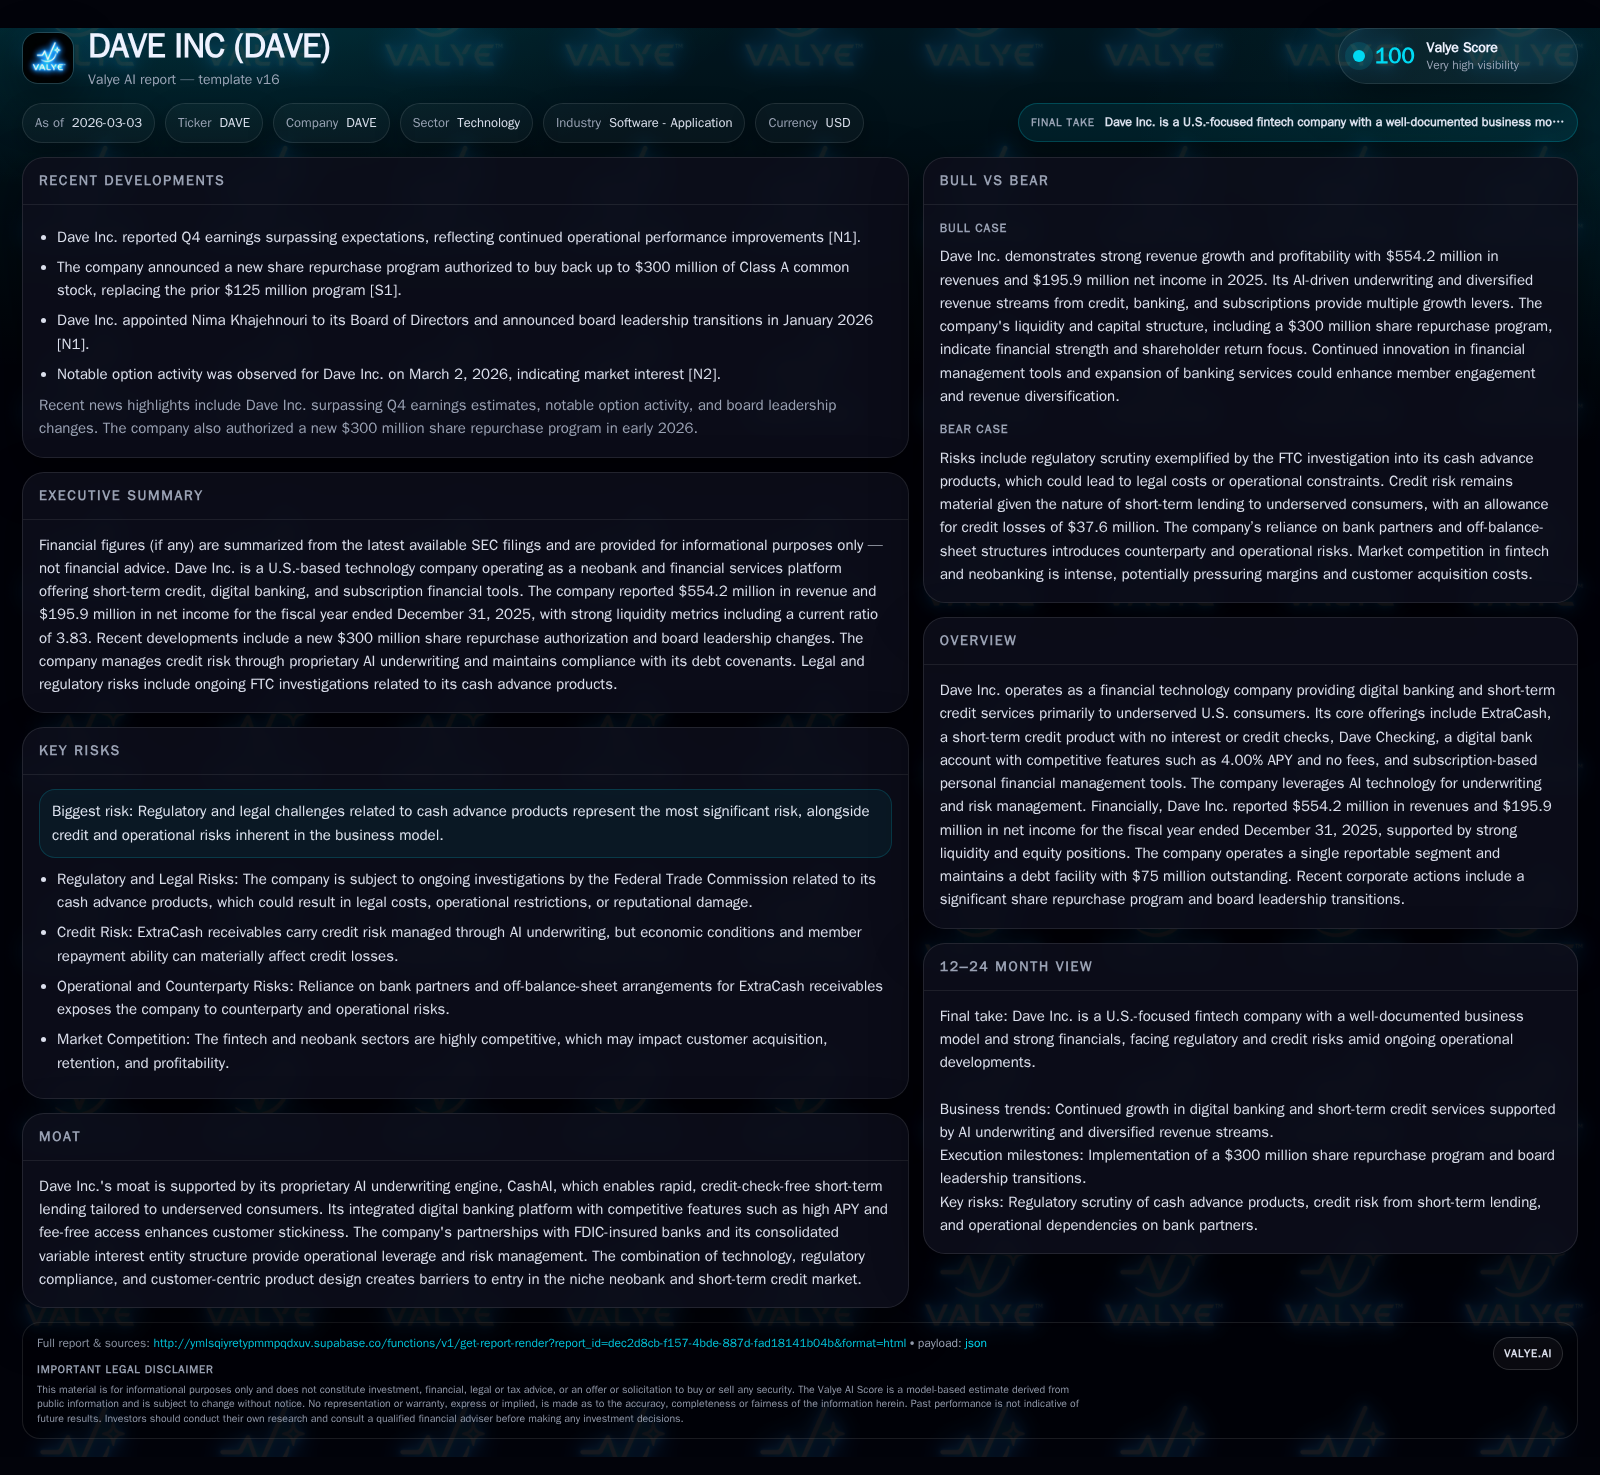
From a history marked by losses, Dave Inc. has rapidly transformed into a profitable fintech player, reaching $554 million in revenues and $196 million in net income in fiscal 2025, driven largely by its AI-powered ExtraCash short-term lending product and fee-free Dave Checking accounts. The company’s CashAI underwriting engine underpins scalable credit issuance without traditional credit checks, supporting risk management amid macroeconomic pressures. Regulatory and litigation risks concerning cash advance products remain significant constraints, while capital allocation has emphasized shareholder returns through aggressive share repurchases and disciplined cash flow use. Looking forward, growth prospects hinge on expanding subscription and transaction revenues, successful navigation of legal hurdles, and potential operational limits related to funding strategies.
From Trailblazer to Profit Leader: Revenue and Earnings Evolution
Dave Inc. has witnessed an extraordinary financial turnaround over the four most recent fiscal years. From a modest top-line of $204.8 million in 2022 marked by a sharp net loss of $128.9 million, the company achieved sustained growth culminating in $554.2 million revenue for the full year ended December 31, 2025—a compound annual growth rate (CAGR) exceeding 40%. Even more striking is the swing in net income, which moved from deep negative territory to a robust profit of $195.9 million in 2025 [F1]. This records a year-over-year (YoY) net income growth of approximately 238%, signaling a critical milestone where scale has combined effectively with margin improvements.
Operating cash flow mirrored this trend advancing from negative $44.9 million in 2022 to positive $290.0 million by end-2025—an impressive leap that underscores both operating leverage and tighter control on working capital [F1]. Capital expenditures remained nominal relative to growing operations, signaling operational efficiency.
Historical performance (annual)
| FY | Rev ($mm) | Net ($mm) | CFO ($mm) | Capex ($) | Rev YoY | Net YoY |
|---|---|---|---|---|---|---|
| 2025 | 554 | 196 | 290 | 317000 | +59.7% | +238.4% |
| 2024 | 347 | 58 | 125 | 262000 | +34.0% | +219.3% |
| 2023 | 259 | -49 | 34 | 688000 | +26.5% | +62.4% |
| 2022 | 205 | -129 | -45 | 728000 |
Source: SEC companyfacts cache [F1].
Capital returns and efficiency (annual)
| FY | Buybacks ($mm) | FCF ($mm) | ROE% |
|---|---|---|---|
| 2025 | 44 | 290 | 55.5 |
| 2024 | 125 | 31.6 | |
| 2023 | 0 | 33 | -55.7 |
| 2022 | 1 | -46 | -121.0 |
Source: SEC companyfacts cache [F1].
Note: Rev YoY % and Net YoY % reflect year-over-year changes between adjacent years.
This spectacular trajectory was powered by the success of Dave’s financial technology platform catering primarily to underserved U.S consumers seeking short-term liquidity without traditional barriers like interest charges or credit checks.
Technological Edge: CashAI’s Role in Scaling Underwriting Success
Central to Dave Inc.’s transformation is its proprietary underwriting engine — CashAI — which evaluates applicants' checking account activity in real-time using advanced machine learning models focused on expected credit loss estimates rather than legacy credit scores [S1][F1]. This process captures subtle behavioral signals embedded within transactional data allowing rapid credit decisions for ExtraCash loans averaging approximately eleven days.
The AI-driven underwriting allows for streamlined risk segmentation with dynamic adjustment based on ongoing performance metrics including collection trends and macroeconomic conditions affecting member repayment capacity [S24]. By eliminating FICO reliance and removing interest or fees on these advances historically funded via ExtraCash receivables held on balance sheet or through Debt Facility draws, Dave manages both scalability and default exposure prudently.
CashAI's agile risk assessment schema bolsters Dave’s moat against entrants as replicating such models requires proprietary data relationships with banking partners plus rigorous regulatory compliance.
Revenue Streams Breakdown: Transition from Optional Tips to Subscription & Transaction Revenues
Historically, optional member tips and processing fees significantly contributed to service-based revenues; however, these were discontinued by February 2025 following business model revisions focused on transparency and regulatory alignment [S1]. This shift notably altered revenue composition towards recurring subscription charges for personal finance management tools alongside transaction-based income derived from interchange fees on Dave Checking accounts—the latter benefiting from high APY deposit balances without conventional fee structures.
Service-based revenue surged from $232 million in 2023 to over $511 million in 2025 even as tip-related revenues ceased, indicating strong uptake of subscriptions priced higher post mid-2025 fee increases—from $1 to $3 monthly—and intensifying usage of transaction products like Mastercard debit cards and ATM networks facilitating fee-free withdrawals for members [F1][S22].
This structural evolution enhances revenue predictability while deepening customer engagement via integrated product suites encompassing budgeting automation savings features alongside job application portals.
Regulatory Hurdles and Litigation: Impact on Business and Risk Management
Despite financial successes, regulatory scrutiny presents salient headwinds. The Federal Trade Commission (FTC) initiated investigations into Dave's marketing practices for its ExtraCash product dating back to January 2023 culminating in formal complaints filed jointly with Department of Justice (DOJ) actions alleging violations of Section 5(a) of the FTC Act alongside consumer protection statutes [S5][S14][S15].
Litigation also extends to class-action suits asserting contraventions of the Military Lending Act (MLA), Truth in Lending Act (TILA), plus state-level laws such as Georgia’s Payday Loan Act [S19][S21]. An additional municipal case filed by Baltimore targets alleged unfair trade practices related to ExtraCash product deployment citing local consumer protection codes.
While management maintains accruals totaling roughly $7.8 million against probable loss contingencies these proceedings introduce material uncertainty given injunction requests coupled with monetary penalties that could reshape operational practices or necessitate further cost burdens [S19]. These regulatory factors impose strategic constraints especially around product design adaptation, compliance costs, and reputational risks.
Balance Sheet Strength and Debt Facility Amendments Amid Covenant Challenges
Dave maintains a senior secured revolving debt facility with Victory Park Management LLC providing up to $150 million borrowing capacity; however, only $75 million was drawn as of December 31, 2025 at an effective interest rate near nine percent annually [S4][S6][S7]. Interest payments are monthly; principal is due at maturity December 2026.
Importantly though covenant breaches occurred related to Minimum Receivable Loan-to-Value ratios during mid-2025 due to portfolio asset quality metrics surpassing thresholds—the company negotiated waivers followed by amendment removal of said covenant entirely reinforcing lender confidence but adding reporting obligations [S7].
Given upcoming maturity within approximately one year management actively evaluates refinancing alternatives or repayment options leveraging ample liquidity including over $123 million combined cash equivalents/investments alongside substantial operating cash flows generated during fiscal year ended Dec-25 ($290m) ensuring no immediate refinancing distress currently foreseeable although pricing remains elevated due to credit sensitivity [S16][S17].
Capital Deployment Strategy: Robust Share Repurchase Program and Cash Flow Management
Reflecting confidence stemming from sustainable profitability improvements Dave has aggressively returned capital via share repurchases starting with a March 2025 authorization of up to $50 million later superseded by an expanded August 2025 plan authorizing up to $125 million total buybacks [S10][S20].
In aggregate during calendar year 2025 approximately $43.7 million was utilized repurchasing common shares enhancing shareholder value while offsetting dilution arising primarily from equity compensation programs [F1][S27]. Capital deployments have balanced preservation of liquidity enabling continued funding support for ExtraCash originations together with controlled operating expenses including tech infrastructure investments capped at approximately $0.3 million annually underscoring disciplined spending priorities alongside marketing activation efforts aimed at customer growth.
Profitability Metrics Decoded: ROE, Operating Cash Flow, and Free Cash Flow Trends
Evaluating beyond headline net income yields critical insight into underlying returns:
- Calculated return-on-equity (ROE) based on reported FY25 net income of ~$196m divided by stockholders' equity approximated at ~$353m implies a ROE near a robust ~55.5%, reflecting extraordinary capital efficiency given prior years’ losses consolidating improvement.
- Operating cash flow’s conversion ratio relative to net income also exceeds unity suggesting accrual reversals or non-cash items favorable under GAAP accounting promote liquidity generation capabilities essential for reinvestment or debt servicing purposes.
- Free cash flow approximates closely operating cash flow less capex revealing near $289.7m unobstructed inflows implying strong corporate flexibility absent material investing outlays supporting core fintech operations sustainably [F1].
Growth Outlook: Indicators, Opportunities, and Potential Operational Constraints
Forward momentum appears intact per recent quarterly earnings beats signaling continued user acquisition momentum across Dave Checking deposits accompanied by incremental adoption of higher-tier subscription offerings bolstered through selective pricing adjustments enhancing blended yield profiles per member engagement metrics reported recently [N1][N9]. Product roadmap hints at layered feature expansion enhancing stickiness such as early direct deposit access combined with refinancing strategies reducing reliance on costly bank financing structures potentially elevating margin expansion prospects further.
However persistent litigation clouds regulatory clarity which could constrain geographic expansion plans or induce product re-engineering costs challenging topline scaling velocities alongside tightening macroeconomic environment pressures constraining discretionary spending ability within target demographics representing main user base underpinning ExtraCash demand levels [N11]. Monitoring adjudications remains critical despite management’s constructive posture toward dispute resolution evidenced through motion filings attempting dismissal emphasizing risk profiles embedded within ongoing legal battles.
What to Watch Next: Monitoring Catalysts for Future Milestones
Key upcoming events include near-term quarterly earnings announcements anticipated around end Q1/Q2-26 cycles providing updated metrics on revenue mix shifts plus user base trajectory including impact assessments from any new regulatory developments impacting business model viability directly reported under SEC mandated disclosures affirming transparency norms simultaneously augmented by evolving share repurchase execution data revealing board confidence trajectory indirectly.
Additionally strategic alliances or innovations introduced leveraging AI-driven analytics may further disrupt incumbent competitors while litigations outcomes pending appeal court decisions will crucially define permissible operating frameworks shaping long-term corporate planning horizons necessitating vigilant observation by stakeholders attentive to catalyst events able ultimately to influence perceived enterprise valuation signals significantly going forward.
Disclaimer: This report is prepared solely for informational purposes based on publicly available documents without forming investment advice or recommendations regarding Dave Inc.'s securities or prospects.
Disclaimer: This is research-only, informational analysis and not investment advice. It may include AI-generated interpretation and general industry context. Always verify important details using primary sources.
Comments