
Dime Community Bancshares' Turnaround: From Volatile Earnings to Strategic Capital Moves
A detailed analysis of Dime Community Bancshares’ financial recovery and strategic capital decisions in a competitive New York banking market.
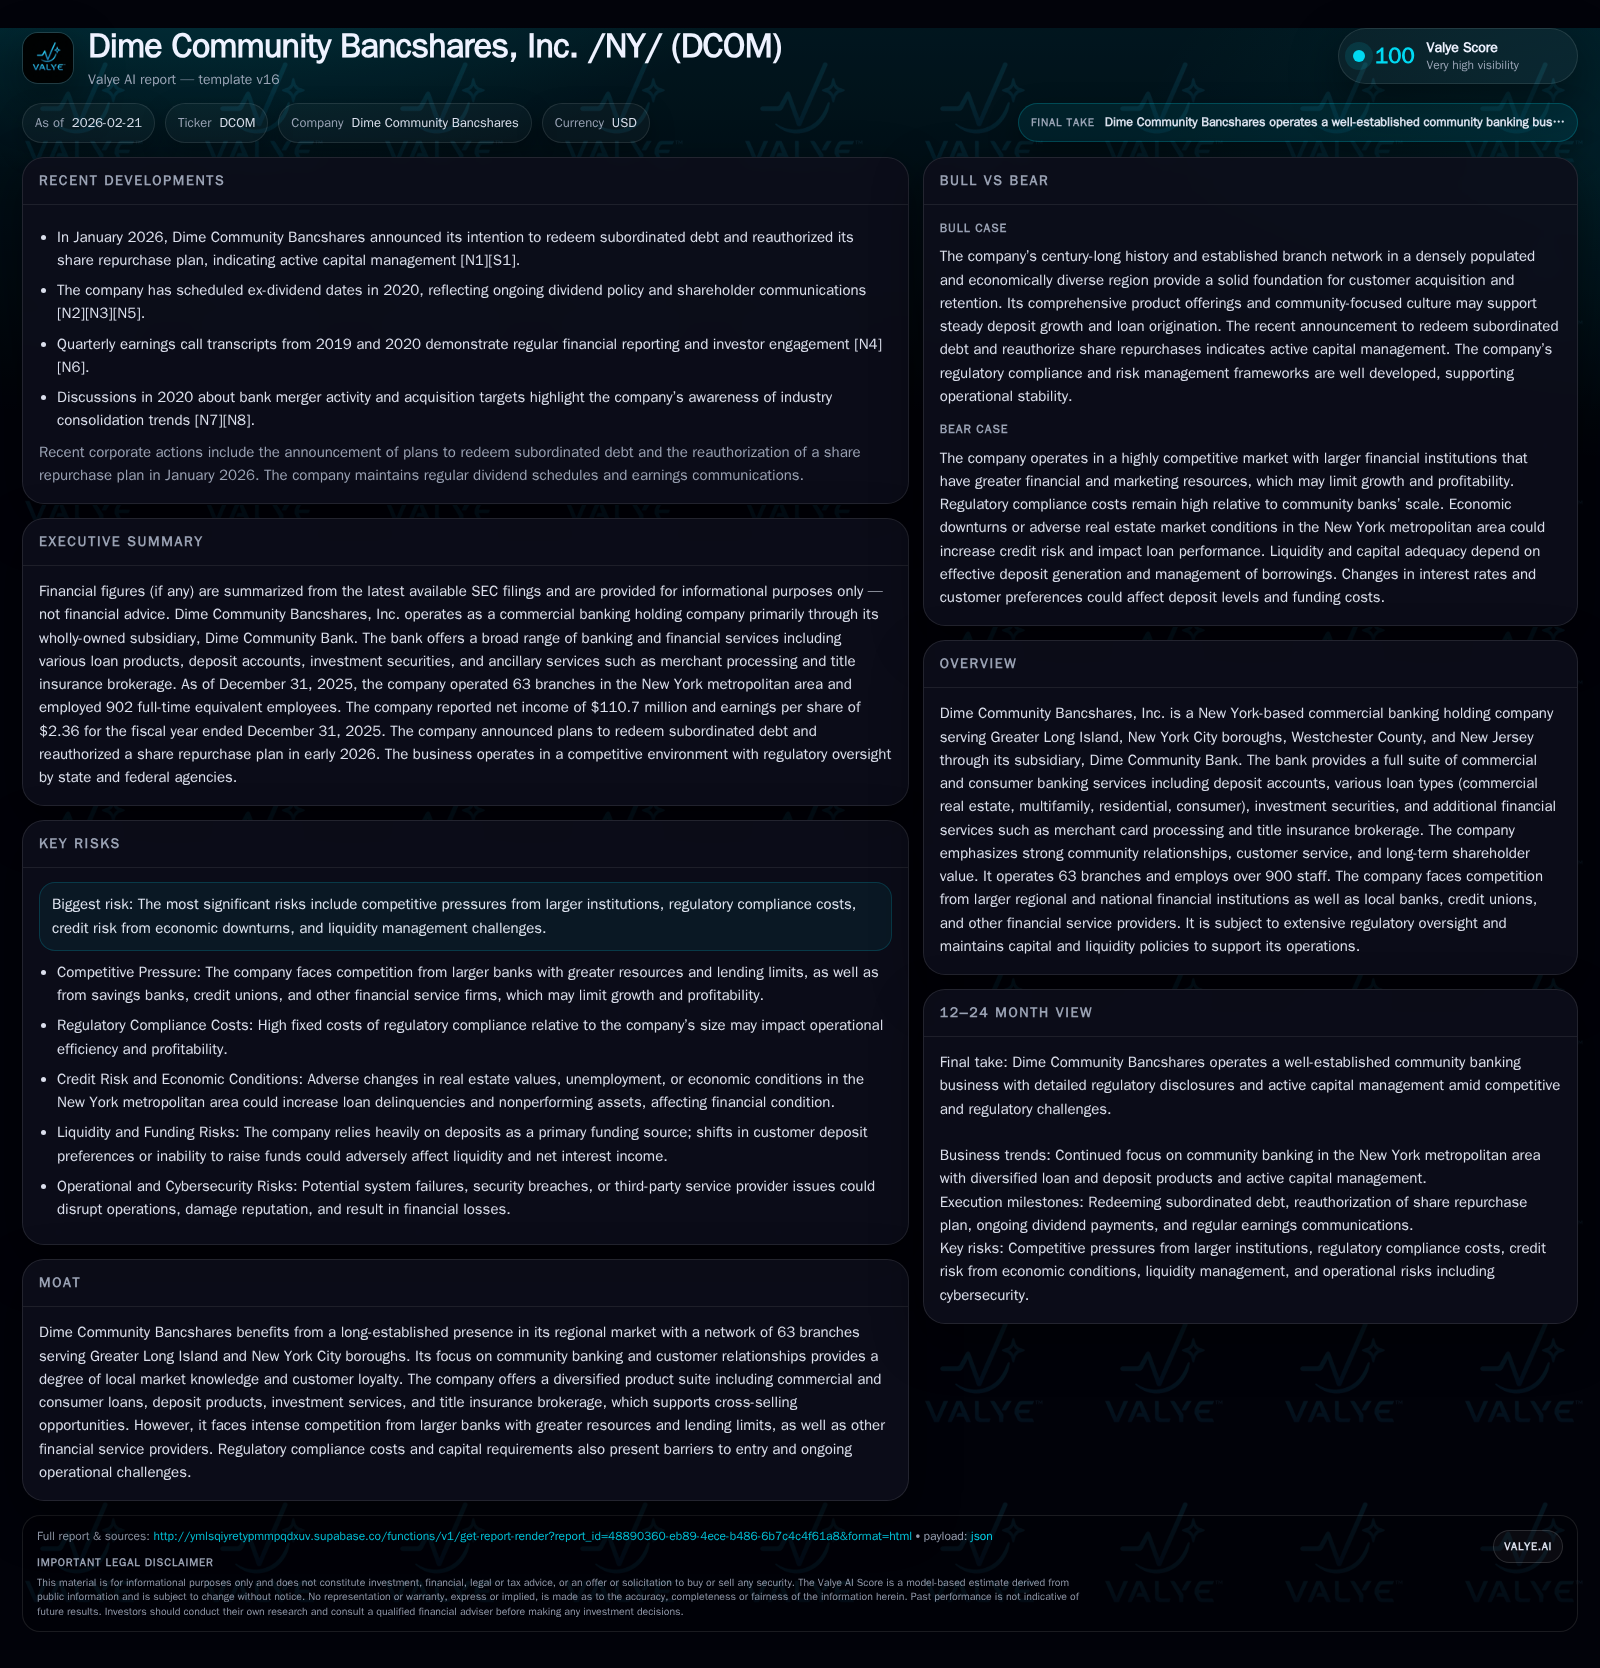
Dime Community Bancshares experienced sharp earnings volatility, with a significant rebound in net income in 2025 driven by growth in real estate loan originations and disciplined liquidity management. The company continues to navigate competitive pressures from larger banks, tight regulatory oversight, and evolving deposit dynamics while optimizing its capital structure through subordinated debt redemption and reauthorization of share repurchases. Investors should monitor its loan portfolio quality, regulatory developments, and funding composition as key indicators of sustainable growth.
From Strained Earnings to a Strong Recovery: Historical Financial Performance
Dime Community Bancshares’ financial journey over the past four fiscal years demonstrates notable volatility tempered by resilience and strategic recovery maneuvers. After posting a net income of $152.6 million in FY2022, the company’s earnings contracted sharply to approximately $29.1 million in FY2024—a decline driven by industry headwinds including market uncertainties and margin compression. However, FY2025 marked a sharp reversal with net income soaring by an exceptional 280.6% year-over-year to $110.7 million [F1]. This rebound signals effective management actions addressing prior challenges.
Operating cash flow (CFO) mirrored this uptick, almost doubling from $99.1 million in 2024 to $186.6 million in 2025 (+88.3%), highlighting strengthened core cash generation capacity despite increased reinvestment as evidenced by capital expenditures that rose substantially by approximately 55% year-over-year [F1]. The company's estimated return on equity (ROE), calculated as net income divided by average stockholders' equity ($1.48 billion at end-2025), stood near 7.5%, indicating improved but modest profitability relative to capital base size.
Historical performance (annual)
| FY | Net ($mm) | CFO ($mm) | Net YoY |
|---|---|---|---|
| 2025 | 111 | 187 | +280.6% |
| 2024 | 29 | 99 | -69.7% |
| 2023 | 96 | 91 | -37.0% |
| 2022 | 153 | 295 |
Note: Omitted columns lack sufficient annual XBRL coverage in the provided tags (need ≥2 annual points): Rev, OpInc, Capex, FCF. Source: SEC companyfacts cache [F1].
Capital returns and efficiency (annual)
| FY | Div ($mm) | Buybacks ($mm) | ROE% |
|---|---|---|---|
| 2025 | 43 | 1 | 7.5 |
| 2024 | 38 | 1 | 2.1 |
| 2023 | 37 | 1 | 7.8 |
| 2022 | 37 | 47 | 13.0 |
Source: SEC companyfacts cache [F1].
*Note: Capex data limited; latest available year is FY2020 at $5.13M though management commentary indicates increased investment in branches and IT.
The marked improvement in profitability after the trough in FY2024 was underpinned by stronger lending activity coupled with tighter expense control and enhanced liquidity measures that stabilized funding costs amid a challenging interest rate environment.
Loan Origination Trends and Growth Drivers in Core Regional Markets
Dime’s lending operations remain heavily concentrated within the Greater Long Island/New York City metropolitan area and neighboring New Jersey markets—regions characterized by dense commercial activity and multifamily housing demand [S18][S22].
In FY2025, the bank originated new business loans totaling approximately $402 million, representing an 8% increase over the prior year’s $371 million [S6]. Notably, new real estate-related loan originations exhibited robust growth, rising sharply from $200 million in FY2024 to nearly $299 million in FY2025—a clear indication of strategic emphasis on commercial real estate (CRE) and multifamily residential loans which compose a significant portion of the overall portfolio.
The loan portfolio mix at year-end highlights the bank’s focused approach:
- Non-owner occupied CRE loans constitute about 27% of total loans held for investment.
- Multifamily residential and mixed-use loans account for roughly 32%, down slightly from prior periods but remaining substantial.
- Business loans have also shown moderate growth maintaining diversified exposure.
This composition reflects management’s prudence toward portfolio risk allocation while leveraging local expertise to identify credit-worthy borrowers within niche property types prevalent across their service footprint.
Competitive Dynamics and Regulatory Factors Shaping Future Growth Potential
Operating within one of the most competitive regional banking markets nationally, Dime faces persistent pressure from larger institutions boasting broader product capabilities, scale advantages, and higher lending limits [S22]. Competing effectively requires balancing localized customer relationship focus against economies of scale enjoyed by regional/national players.
Moreover, the burden of extensive regulatory compliance remains heavy relative to the bank’s size. Community banks like Dime bear disproportionately higher fixed costs related to evolving consumer finance regulations—including federal Bank Secrecy Act adherence, anti-money laundering programs, privacy protections as well as scrutiny from agencies such as CFPB—that inflate operating expenses [S8][S19]. These factors constrain margin expansion potential despite revenue opportunities.
The intensifying focus on fair lending practices further adds complexity requiring ongoing training and internal controls investments.
Economic variables—such as fluctuating interest rates affecting deposit flows, credit demand variability influenced by cyclical swings in housing markets and commercial construction—are additional externalities impacting strategic growth paths [S11]. The bank's ability to sustain origination momentum depends on nimble underwriting approaches aligned with these dynamics complemented by diligent market monitoring.
Liquidity Management and Capital Structure Optimization in 2025
Liquidity stewardship represents a core pillar underpinning Dime’s operational stability amid banking sector volatility observed broadly across financial markets. The company maintains rigorous liquidity oversight via its Asset Liability Committee (ALCO), which deploys daily cash position reporting alongside comprehensive forecasts covering up to twelve months of cash flows—ensuring readiness against deposit withdrawals or drawing needs for new loans [S4][S5].
At December 31, 2025, the bank reported substantial unutilized borrowing capacity through Federal Home Loan Bank of New York (FHLBNY) advances amounting to approximately $1.52 billion subject to collateral eligibility requirements [S4][S6]. Lines of credit through the Federal Reserve Bank Discount Window further supplement short-term funding options—reporting an unused balance near $349 million secured principally by investment securities—and segregated multi-billion dollar Credit Facility commitments backed by mortgage loan collateral demonstrate layered contingencies enhancing resiliency.
A notable capital structure action emerged early 2026 when Dime announced intent to redeem all outstanding $40 million principal amount fixed/floating subordinated debentures due 2030 at par value scheduled for March redemption [N1][S3]. This move aligns with strategies aimed at reducing future interest expense associated with these junior liabilities without compromising regulatory capital buffers currently compliant with 'well-capitalized' standards [S6][S7].
Such maneuvers reflect an active approach toward funding cost optimization balanced against maintaining flexibility for anticipated lending growth or opportunistic investments.
Shareholder Returns: Dividend Policy and Share Repurchase Activity
While direct share repurchases have been restrained historically—with minimal common stock buybacks averaging approximately $947 thousand annually post-2022—the company sustained steady cash dividends distributions on common stock rising from roughly $38 million in FY2024 to $42.9 million in FY2025 signaling stable distribution commitment amidst earnings recovery [F1][N1][S7].
Preferred stock dividends remained flat at about $7.3 million paid annually for both years reflecting consistent obligations on Series A preferred shares outstanding [F1].
The January 2026 announcement on reauthorizing share repurchase programs signals potential recalibration allowing more proactive capital returns when discretionary excess capital becomes available after core reinvestment priorities are satisfied [N1]. Such plans provide management latitude to enhance shareholder value effectively over time with balanced risk-return considerations.
What Investors Should Watch: Upcoming Milestones and Risks
Absent explicit forward guidance beyond announced debt redemption plans or reauthorization of buybacks, stakeholders should closely follow several leading indicators:
- Evolution of loan origination volumes particularly concentration shifts between CRE versus other business or consumer segments which can signal shifts either mitigating or elevating credit risk exposure.
- Regulatory developments including any tightened rules under consumer protection statutes or anti-money laundering frameworks that might increase compliance cost burden constraining profit margins or limiting product innovation capability.
- Deposit base composition trends focusing intensively on uninsured balances fluctuations which may impact liquidity risk profile given heightened sensitivity around depositor reactions amid volatile macroeconomic environments.
- Interest rate environment influences on asset yields versus deposit beta effects shaping net interest margin trajectory — critically important given regional banks’ dependency on core deposits' low-cost funding advantages.
- Competitive activities—new entrants or enhanced digital offerings—that could erode traditional community banking relationship advantages necessitating faster adaptation or accelerated technology investment cycles.
Credit risk remains paramount; management's enhanced stress testing for interest reset risk addresses concern over borrower repayment capacity under rising financing costs predominant since late-cycle monetary tightening started earlier this decade shift phase [S18].
Overall vigilance around these factors will be crucial for interpreting operational resilience versus episodic earnings swings consistent with prior experience while assessing sustainable growth prospects amidst complex industry headwinds.
Disclaimer: This analysis is based solely on publicly available information as cited herein including SEC filings [S#], news releases [N#], and company financial data [F1] as of early 2026 without predictive commentary or investment advice.
Disclaimer: This is research-only, informational analysis and not investment advice. It may include AI-generated interpretation and general industry context. Always verify important details using primary sources.
Comments