
Dine Brands Global’s 2025: Growth Rebound Contrasted by Profit and Leverage Challenges
Dine Brands posted robust revenue growth in 2025 despite sharp net income compression and increased leverage pressures.
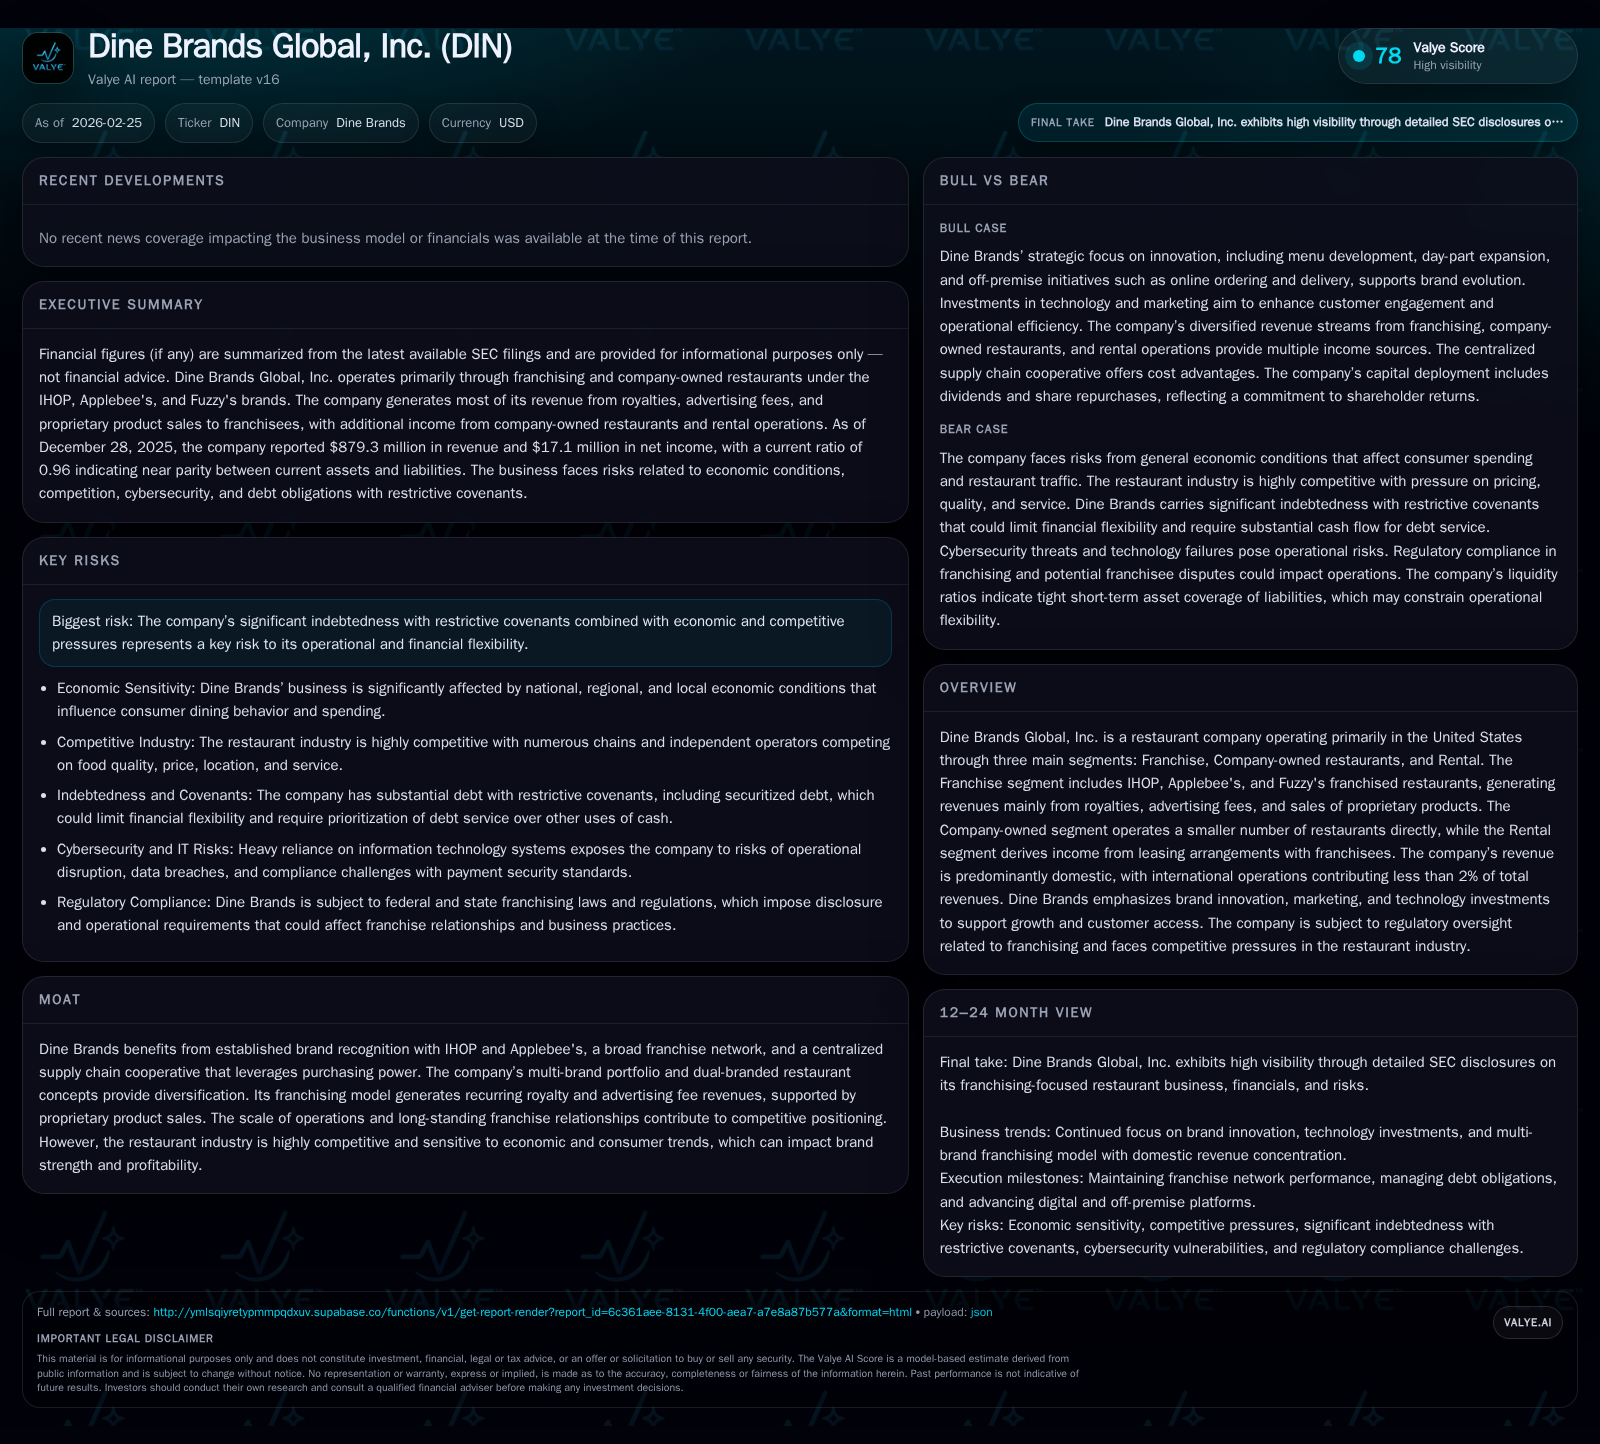
In fiscal 2025, Dine Brands Global achieved an 8.2% revenue increase driven predominantly by franchise royalties and advertising fees from its IHOP and Applebee’s brands, supported by its multi-brand franchise model. However, net income plunged 73.6% amid margin pressures from rising operating costs and restructuring expenses. The company significantly increased capital expenditures, reflecting strategic reinvestments, even as operating cash flow declined. Elevated debt levels and restrictive securitized debt covenants intensified refinancing risks, while capital allocation favored aggressive share buybacks and maintained dividends, raising questions around financial flexibility.
2025 Financial Performance Highlights: Growth and Margin Pressures
Fiscal year 2025 saw Dine Brands Global reporting a marked contrast between a healthy top-line expansion and a significant profitability challenge. Revenues rose by 8.2%, reaching $879.3 million compared to $812.3 million in the prior year [F1]. This growth was primarily driven by enhanced franchisor royalties, advertising fees, and proprietary product sales linked predominately to the IHOP and Applebee's concepts within the company's franchise segment [S1][S10].
Yet net income declined precipitously, down 73.6% year over year to $17.1 million from $64.9 million in 2024 [F1]. The decline reflected increased general and administrative expenses alongside restructuring charges documented in their filings [S1]. Operating cash flow also contracted by approximately 17.7% to $89 million from $108.16 million the previous year [F1], intensifying pressure on liquidity amid a surge in capital expenditures which more than doubled to $35.6 million reflecting reinvestment efforts [F1].
This divergence pressured return on equity into negative territory (~-6.2%) with stockholders' equity deepening further into negative at -$273.9 million [F1], signaling balance sheet stress.
Historical performance (annual)
| FY | Rev ($mm) | Net ($mm) | CFO ($mm) | Capex ($mm) | Rev YoY | Net YoY |
|---|---|---|---|---|---|---|
| 2025 | 879 | 17 | 89 | 36 | +8.2% | -73.6% |
| 2024 | 812 | 65 | 108 | 14 | -2.3% | -33.2% |
| 2023 | 831 | 97 | 131 | 37 | -8.6% | +19.8% |
| 2022 | 909 | 81 | 89 | 35 |
Note: Omitted columns lack sufficient annual XBRL coverage in the provided tags (need ≥2 annual points): OpInc. Source: SEC companyfacts cache [F1].
Capital returns and efficiency (annual)
| FY | Div ($mm) | Buybacks ($mm) | FCF ($mm) |
|---|---|---|---|
| 2025 | 61 | 53 | |
| 2024 | 12 | 94 | |
| 2023 | 32 | 26 | 94 |
| 2022 | 31 | 120 | 54 |
Source: SEC companyfacts cache [F1].
Note: Operating income is not available from provided tags; ROE calculated as Net Income / Equity where Equity was negative.
Drivers Behind Revenue Expansion and Their Sustainability
The revenue rebound in FY25 was anchored squarely within the Franchise segment where the company earns recurring royalty streams and advertising fees from its IHOP, Applebee's, and Fuzzy's franchises [S10]. These brands benefit from established customer loyalty and brand recognition across a dense domestic network primarily positioned in midscale casual dining.
Innovative approaches such as dual-branded restaurant formats combining Applebee's with IHOP units provide operational synergies and footprint optimization that helped sustain royalty growth [S1][F1]. Proprietary product sales also contribute consistent ancillary revenue.
However, international operations remain negligible (less than 2%), indicating geographic concentration risk remains focused on U.S market conditions [S10]. Given the sensitivity of consumer discretionary spending patterns to economic cycles—especially within mid-tier dining—the sustainability of these royalty gains hinges on maintaining competitive brand positioning.
Profitability and Cash Flow Dynamics Amid Increased Costs
Despite growing revenues, profitability contraction in FY25 was largely driven by rising G&A expenses including incremental restructuring costs reported in their disclosures [S1]. This expense pressure highlights challenges scaling operational efficiencies within both franchise support functions and company-owned restaurants.
Operating cash flow fell nearly 18%, exacerbated by a near tripling of capex outlays to $35.6 million versus just $14.1 million the year before as the firm ramped investments into infrastructure improvements including technology upgrades [F1][S26]. While this reinvestment strategy aligns with long-term brand innovation goals, it short-term reduced free cash flow available for shareholder returns or debt paydown.
Nonetheless, free cash flow generation remained positive at approximately $53 million (CFO less capex), supporting ongoing financial commitments albeit pressured relative to prior years.
Franchise Model Benefits Versus Company-Owned Risks
Dine Brands’ predominant franchising model underpins revenue resilience via stable royalty fee streams less directly exposed to variable operating margins inherent to restaurant operations [S10]. This model reduces fixed cost burdens for the company while leveraging scale across thousands of franchise locations.
Conversely, the smaller portfolio of company-owned restaurants introduces volatility risks as these outlets bear full operational costs—including labor, food inflation impacts, rent, and utility expenses—which have been escalating throughout recent periods amid competitive market dynamics [S1].
Investments in brand innovation—such as menu development, marketing pushes, and dual-branded concepts—aim to enhance franchisee value propositions but require balancing against maintaining profit margins in owned stores.
Capital Allocation: Buybacks, Dividends, and Investment Priorities
In a notable shift reflecting confidence or liquidity availability despite profit pressures, Dine Brands expanded share repurchase activity substantially with $60.7 million spent on buybacks in FY25 versus just $12.1 million in FY24 [F1][S17][S20]. Such aggressive buybacks occur alongside steady dividend payments around $31.7 million over recent periods demonstrating commitment to returning capital even amid earnings compression [F1][S20].
This approach raises questions about flexibility given shrinking net income and negative equity headwinds but underscores management prioritization of shareholder returns while navigating leverage challenges.
Leverage Profile and Debt Maturity Considerations
Dine Brands carries significant indebtedness secured by nearly all domestic revenue-generating assets through complex securitization structures that restrict operational flexibility via stringent covenants [S4][S6][S7]. The key covenant caps total debt at a leverage ratio no higher than 5.25x adjusted EBITDA—a threshold that management has occasionally exceeded but managed principal repayments accordingly [S6][S8].
Upcoming maturities combined with potential rapid amortization triggers pose refinancing risks should market conditions sour or earnings volatility persist [S7][S9]. Failure to comply may result in acceleration of debt repayment obligations potentially impairing business continuity given high dependency on securitized asset collateralization.
Credit rating downgrades would exacerbate these challenges affecting borrowing costs and liquidity access.
Technology Investments Supporting Brand Innovation and Operations
A strategic thrust driving part of increased capex is upgrading digital interfaces such as POS systems enabling better consumer interactions across dine-in, takeout, and delivery channels—a segment increasingly vital for restaurant traffic retention [S26][S27].
Improvements also target supply chain management efficiencies supporting proprietary product distribution critical to maintaining consistent franchise-wide quality standards and brand integrity.
Technology adoption bolsters marketing campaigns through enhanced data analytics facilitating targeted promotions consistent with consumer preferences.
However technological failures or cybersecurity breaches could materially disrupt operations or damage relationships with franchisees questioning ongoing system resiliency investments.
Regulatory Context and Competitive Challenges in U.S. Franchising
The franchising landscape is subject to layered federal/state regulations including employee classification laws impacting franchisee labor models alongside nutritional disclosure mandates increasing compliance cost structures [S26][S27].
Heightened scrutiny over advertising standards particularly within quick-service segments influences promotional strategies requiring careful navigation so as not to alienate price-sensitive customers.
Competition remains fierce within midscale dining with numerous casual dining chains vying for discretionary consumer spending amidst shifting preferences towards fast-casual or convenience-focused formats—pressuring legacy brands like IHOP/Applebee's to innovate continually while managing cost structures tightly.
Disclaimer: This analysis is for informational purposes only based on publicly available data as of February 2026; it does not constitute investment advice or recommendations.
Disclaimer: This is research-only, informational analysis and not investment advice. It may include AI-generated interpretation and general industry context. Always verify important details using primary sources.
Comments