
Dollar Tree's 2026 First Quarter Update: Tariff Pressures and Cash Management in Focus
The latest quarterly report spotlights Dollar Tree’s liquidity strength and operational challenges from tariff-induced cost pressures.
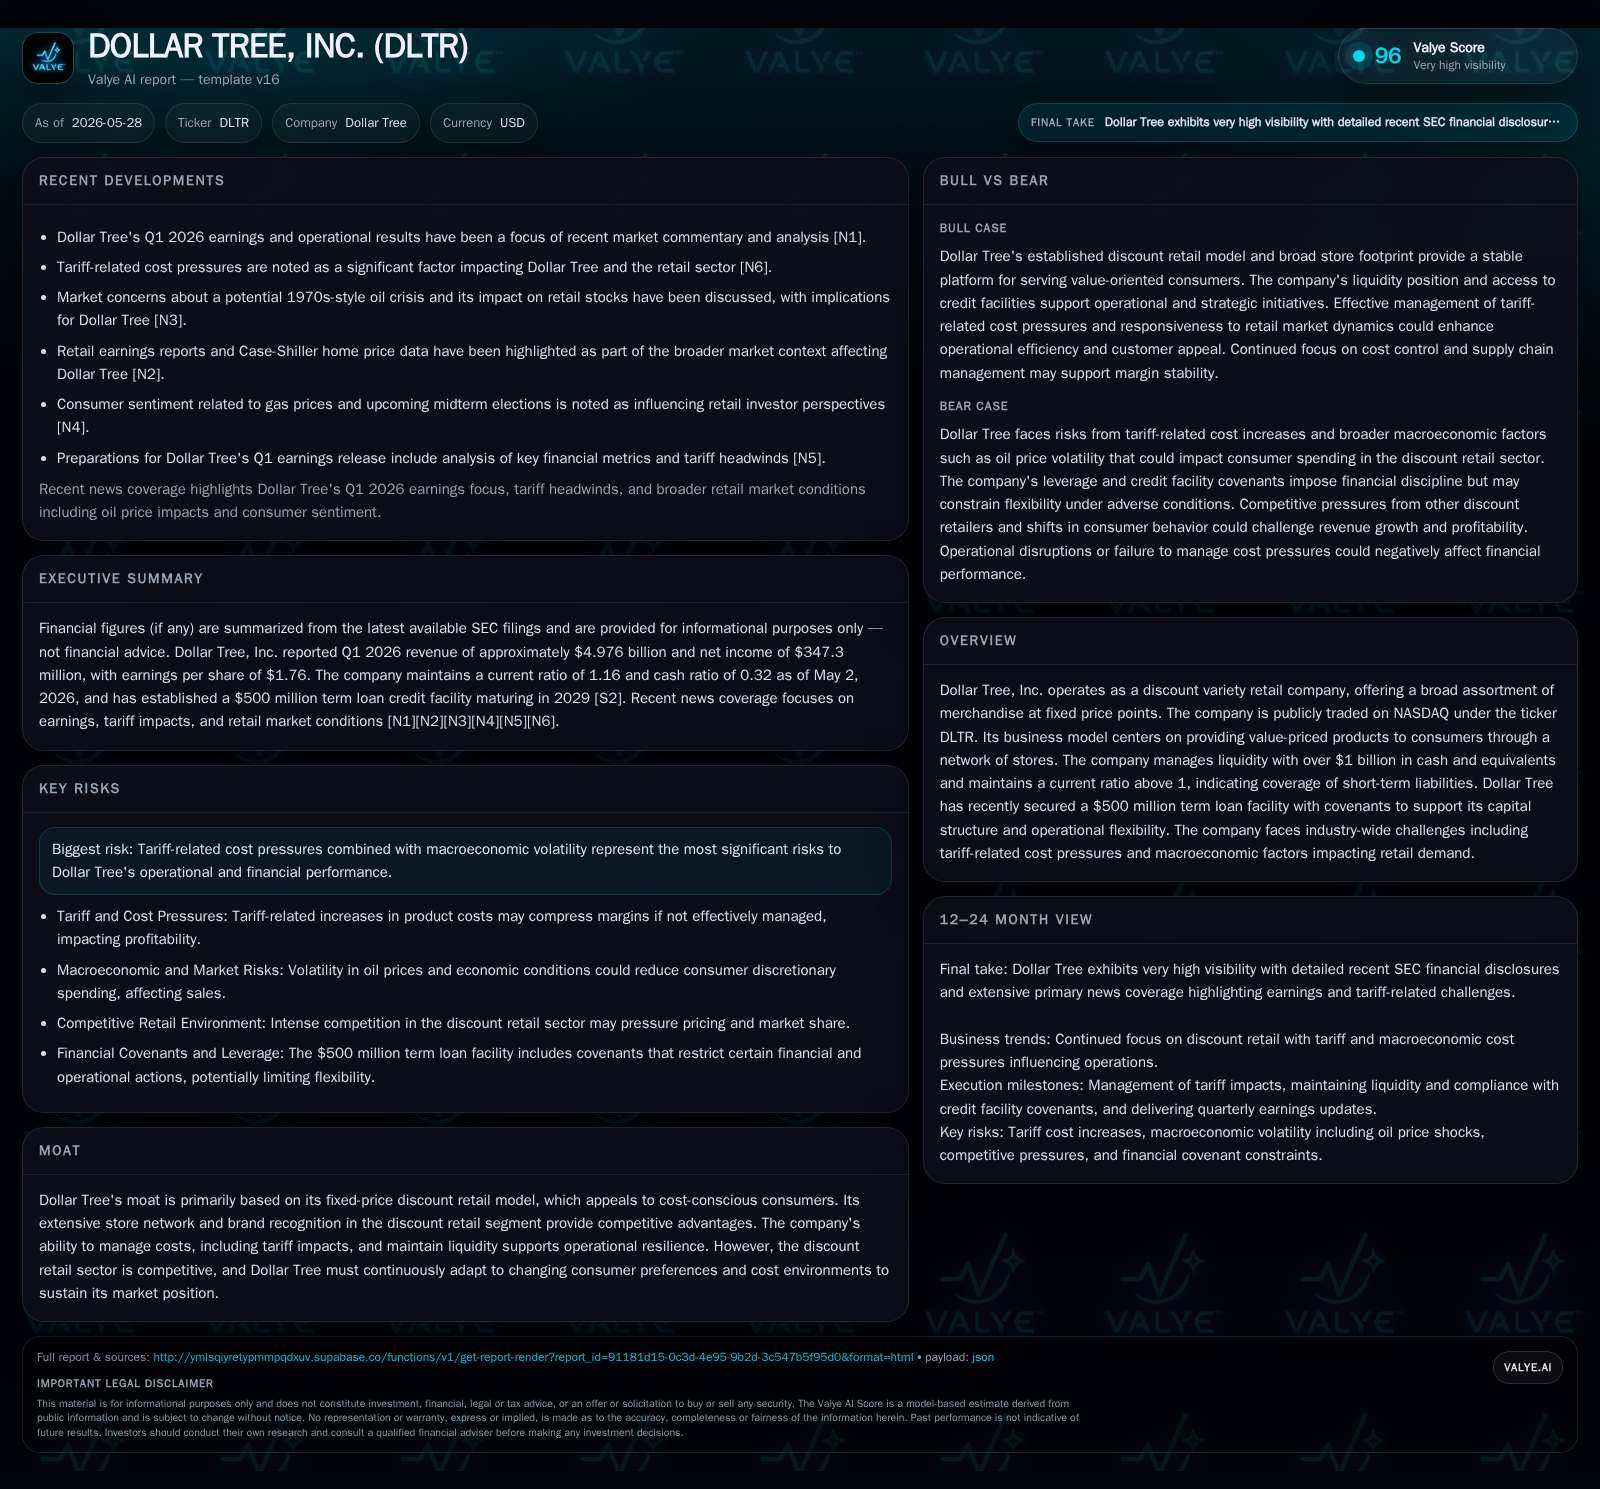
Dollar Tree’s first quarter 2026 filing reveals a robust liquidity position with over $1 billion in cash and a recent $500 million term loan facility supporting its capital structure amid ongoing tariff-related cost headwinds. Operating within the fixed-price discount retail segment, the company contends with inflationary pressures while leveraging its extensive store network and brand recognition to maintain customer loyalty. Competitive dynamics in the discount variety retail space intensify as peers also adapt to tariffs and regulatory scrutiny, but Dollar Tree’s scale and operational efficiencies remain key defenses. Near-term growth hinges on product mix optimization, cost management, and monitoring consumer spending trends against a backdrop of macroeconomic uncertainty.
Latest Quarterly Operating Update: Highlights and Implications
Dollar Tree’s fiscal first quarter 2026 (ended May 2) filing highlights ongoing cost pressures largely driven by tariff increases impacting import costs. The company maintains over $1 billion in cash and equivalents and holds a current ratio of approximately 1.16, evidencing sufficient short-term asset coverage against liabilities [S2][F1]. A notable development is the March 2026 completion of a $500 million term loan credit facility extending through March 2029 that provides enhanced capital structure flexibility without mandatory amortization requirements [S16]. This facility’s covenants include leverage limits and fixed charge coverage ratios designed to support operational resilience.
Despite these strengths, tariff-related input cost increases remain a significant operational headwind acknowledged explicitly in the quarterly discussion sections [S2]. Higher commodity costs feed into product sourcing expenses given Dollar Tree’s reliance on imported goods sourced at fixed price points. The timing of Easter sales season also affected short-term revenue patterns due to earlier observance compared to prior year periods, complicating quarter-over-quarter comparisons [S1]. These factors together frame the Q1 operating environment as one balancing sustained consumer demand for value retail with margin pressure stemming from external cost escalation.
Dollar Tree’s Business Model: Fixed-Price Value Proposition and Customer Appeal
Dollar Tree operates predominantly through stores offering an extensive array of merchandise at uniform low price points—traditionally $1.00 or near that mark—anchoring its value proposition squarely on price simplicity and affordability [S1]. This model attracts budget-conscious shoppers seeking essential household items, seasonal goods, consumables, and small discretionary purchases without the complexity of variable pricing.
The strategic divestiture of Family Dollar completed mid-2025 has enabled a more focused investment in the core Dollar Tree format with tailored product assortment strategies emphasizing consistent pricing integrity coupled with broad merchandise depth [S1]. Sourcing decisions balance cost control imperative against maintaining merchandise quality to preserve customer trust amid intensified scrutiny around product safety recalls or regulatory adherence related to labeling, ingredient transparency, or labor compliance [S1]. Tariffs on imported goods add an extra layer of challenge here; mitigating their impact requires careful supplier negotiations and continuous vendor management efforts.
Customer retention is supported by Dollar Tree's widespread store footprint and brand recognition which facilitate convenient access and drive repeat visits. However, switching costs remain relatively low given alternative discount retailers’ presence; thus, sustaining relevance through product mix refreshes and service experience remains critical.
Competitive Positioning and Industry Structure in Discount Variety Retail
Within the highly competitive discount variety retail sector, Dollar Tree contends with retailers such as Five Below that also engage price-sensitive shoppers but often target slightly different demographics using multi-price tiering strategies and digital engagement tools to attract Gen Z consumers [N11][N12]. Unlike some peer competitors who diversify price points more broadly or emphasize experiential shopping layers, Dollar Tree’s strict fixed-price format provides clarity but constrains pricing power amid cost inflation.
Industry-wide tariff pressures affect all players sourcing standardized inexpensive goods overseas; however, firms vary in their effectiveness at absorbing or offsetting these through supply chain reshuffling or internal productivity investments [N12]. Additionally, regulatory environment intensification—especially concerning pricing transparency laws requiring clear communication of markdowns or price changes—adds compliance complexity that imposes operational costs disproportionately affecting lower-margin stores like Dollar Tree’s fixed-price outlets [S1]. Retail shrinkage stemming from increased theft rates further compresses margins despite investments in technology-based loss prevention solutions.
Strategic Growth Drivers: Store Network, Cost Management, and Product Mix
Growth for Dollar Tree lies primarily in expandability of its store network combined with leveraging economies of scale to temper input cost inflation effects. With thousands of locations across varied geographies operating under a uniform price model, incremental gains emerge through optimized procurement volumes and distribution efficiencies [S2][S1].
Post-Family Dollar exit allows capital redeployment into accelerated remodeling programs enhancing store layouts that better highlight value assortments while reducing operational redundancies. Evolving product mix toward more multi-tiered pricing options within select categories also attempts to capture incrementally higher spend per trip without undermining core bargain appeal.
Technological investments targeting supply chain digitization offer tangible benefits including improved inventory forecasting precision helping avoid markdowns or stockouts during seasonal peaks (such as Easter shifting calendar timing impacting sales velocity) [S2]. Seasonal sales drivers remain cyclical yet structurally supportive given sustained consumer inclination toward discount formats during economic downturns.
Risks and Constraints: Tariff Headwinds, Macroeconomic Sensitivity, and Regulatory Pressures
Tariff escalations represent the foremost operational risk; sustained cost increases reduce gross margins unless price adjustments are feasible—which they are not easily in a strict fixed-price context. This necessitates continuous supplier renegotiations or sourcing alternatives but does not eliminate inherent margin compression risk entirely [S2][S1]
Macro factors influencing discretionary spending volumes—including housing market softness or inflationary pressures unrelated to tariffs—introduce variability in customer purchase frequency or basket size impacting top line unpredictably. Inventory shrinkage risks related to theft have become pronounced industry-wide; failures in loss prevention translate directly into elevated costs that squeeze profitability at narrow margins typical for discount retail outlets; measureable mitigation expenses contribute to operating cost escalation [S1]
Regulatory compliance demands continue expanding across multiple fronts including pricing clarity mandates, food/consumer safety standards for private label lines, labor laws governing hourly wage adjustments, data privacy protections around digital platforms deployed for loyalty programs—all raising compliance-related operating expenditures that may not currently be fully incapsulated into standard budgeting processes.
Key Near-Term Monitors: Earnings Guidance, Margin Trends, and Consumer Demand Signals
Upcoming earnings calls should be carefully scrutinized for updates on guidance revisions especially regarding tariff cost pass-through timeline assumptions and margin trajectory outlooks given evolving supply/demand conditions noted during Q1 results release as well as subsequent updates provided via press releases or investor presentations [S3][N3][N7]
Inventory turnover metrics aligned with event timing such as Easter's occurrence provide early glimpses into demand momentum shifts embedded within different calendar quarters affecting sales phasing balance sheet days inventory outstanding profiles.
Monitoring foot traffic patterns both at store level via internal proprietary data sharing across regions alongside broader macroeconomic indicators such as Case-Shiller home price indices can yield directional insights into underlying consumer confidence trends relevant for discretionary basket growth potential over medium term horizons [N8]
Concise Financial Profile: Liquidity, Leverage, and Profitability Snapshot
Dollar Tree reports revenues approximating $19.4 billion on a trailing twelve-month basis with operating income near $1.65 billion reflecting modest operating margins consistent with low-price retailing strategy complemented by tight expense controls [F1]. Net income stands around $1.28 billion confirming profitable operations despite cost headwinds.
Robust cash reserves exceeding $1 billion serve as liquidity buffer while total debt levels approach $2.45 billion resulting in net debt roughly $1.44 billion—a leverage ratio manageable under current covenant frameworks reinforced by recent issuance of the $500 million term loan facility introduced early 2026 enhancing capital availability without immediate amortization obligations [F1][S16]. These financial parameters underpin operational continuation capabilities even if tariff pressures extend longer than anticipated.
This analysis is based solely on official company disclosures up to May 28, 2026 ([S2],[S3],[S16],[F1]) augmented by sector context insights documented from publicly available sources without speculative forecasting or investment advice.
Disclaimer: This is research-only, informational analysis and not investment advice. It may include AI-generated interpretation and general industry context. Always verify important details using primary sources.

Comments