
Dorchester Minerals’ Growth and Yield Strategy Confronts Commodity Price Volatility
Focused on managing a diversified oil and gas royalty portfolio, DMLP balances accretive acquisitions against volatile energy markets and operational dependencies.
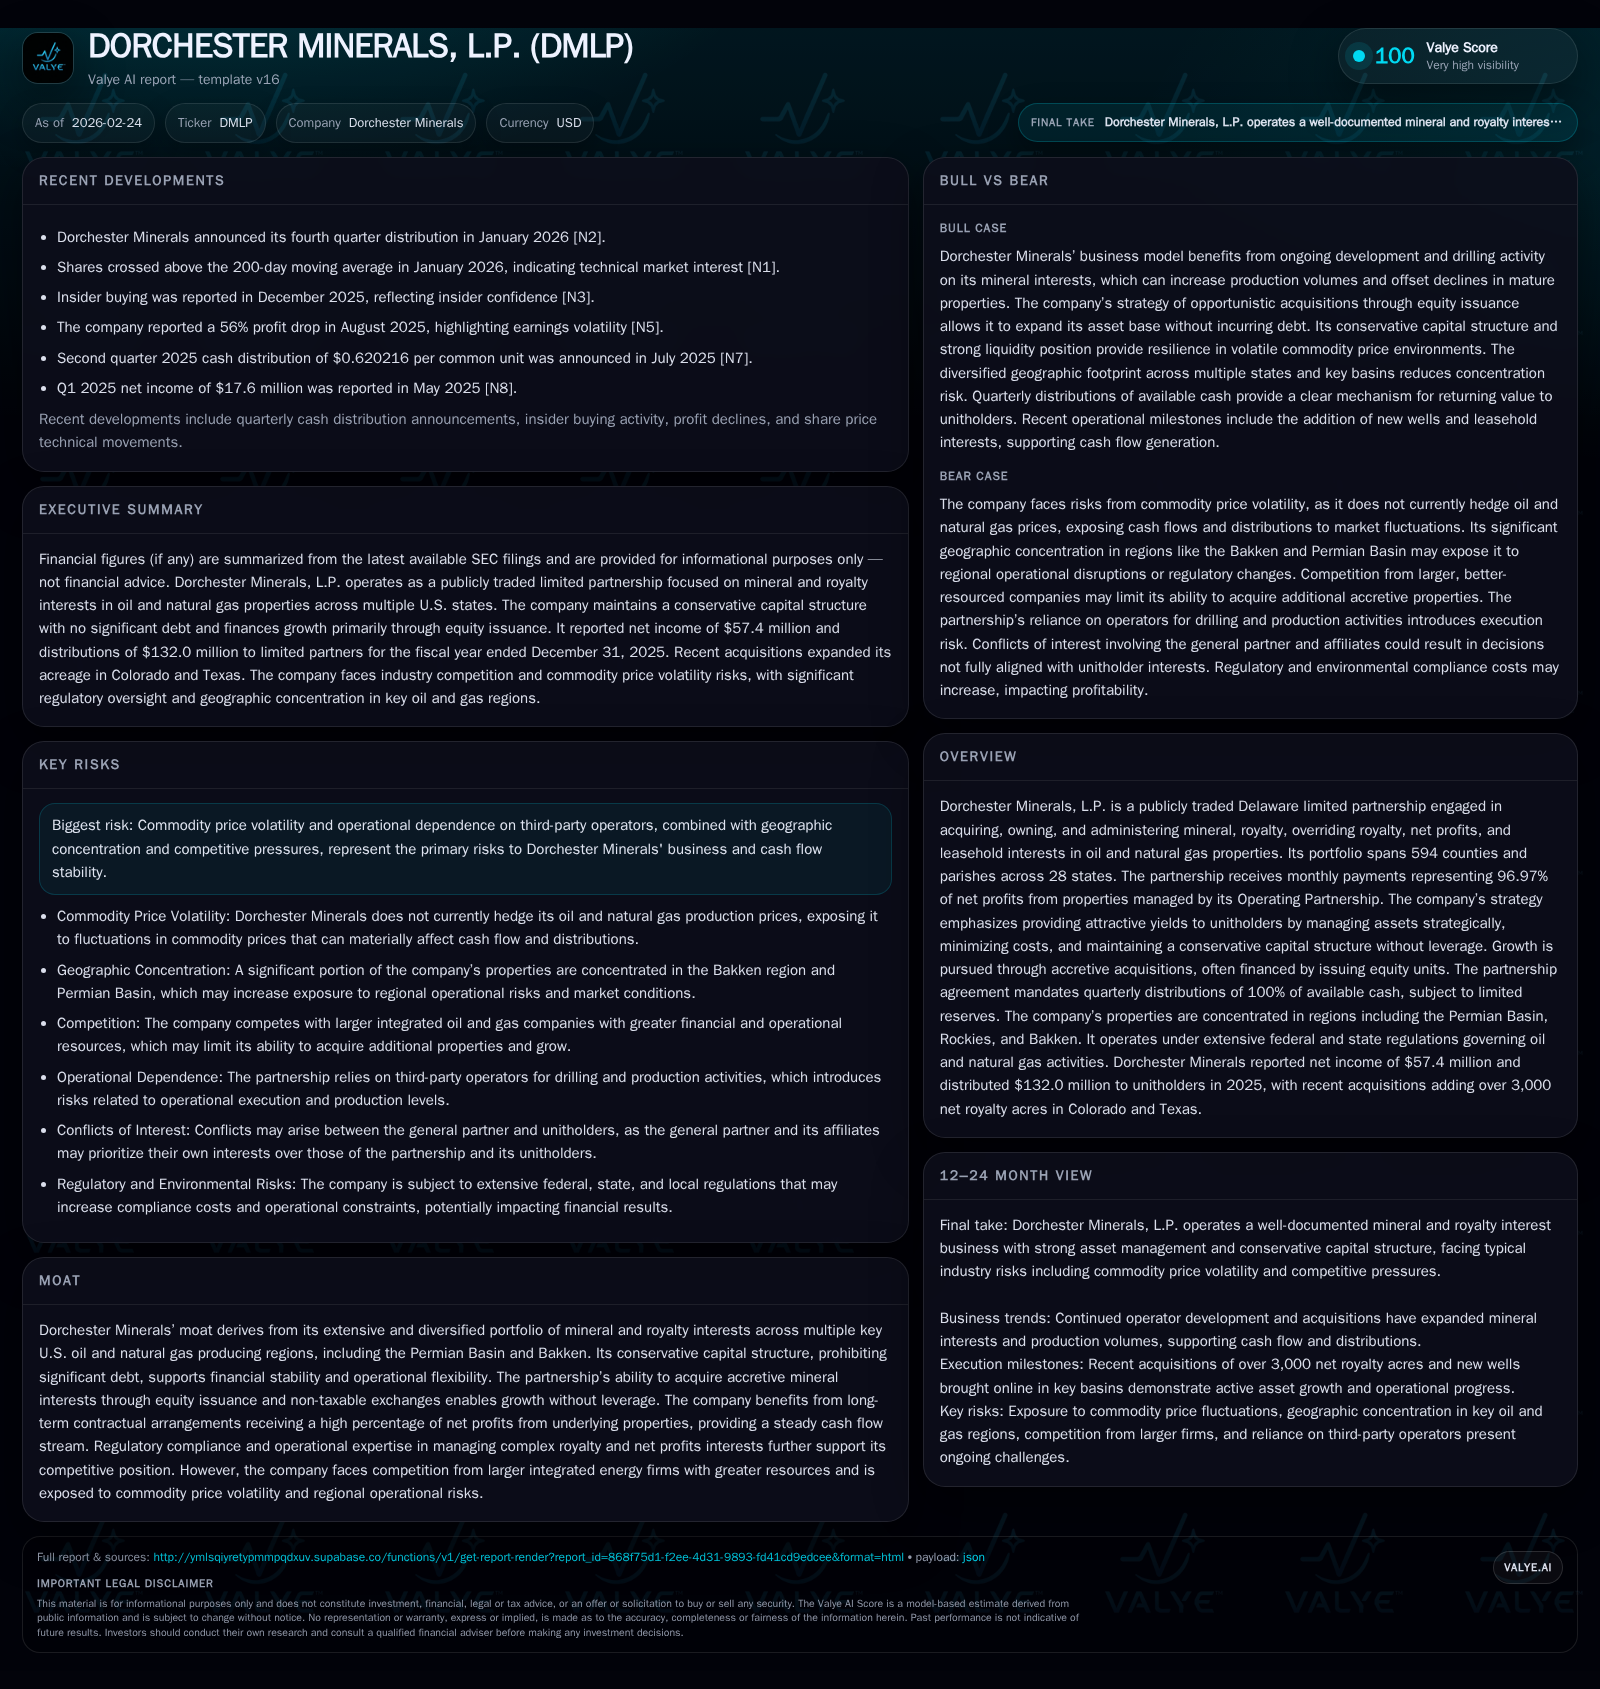
Dorchester Minerals, L.P. operates as a royalty and mineral interest owner across key U.S. oil and natural gas producing regions, relying on payments derived from operators' production without direct control over operations. Historically, its growth was driven by acquisitions funded primarily through equity issuance, while maintaining a conservative capital structure with no leverage. The company faced headwinds in fiscal 2025 due to lower realized oil prices and reduced drilling in the Bakken region but offset this with increased activity in the Rockies and acquisitions. Its capital allocation policy emphasizes quarterly distributions of available cash, with strategic asset management central to sustaining yields. Volatility in commodity prices, regulatory risks, and dependence on third-party operators remain significant challenges.
Company Overview
Dorchester Minerals, L.P. (DMLP) is a publicly traded Delaware limited partnership specializing in acquiring and managing mineral, royalty, overriding royalty, net profits interests (NPI), and leasehold interests tied directly to oil and natural gas production across the United States. As of its latest filings ending December 31, 2025, the company owns interests spanning 594 counties and parishes within 28 states.
The partnership's core competitive advantage stems from this extensive geographic diversification concentrated primarily within prolific basins such as the Permian Basin, Bakken region, and Rockies. Crucially, Dorchester operates without direct control over the underlying properties—relying instead on payments equating to approximately 96.97% of net profits realized by its Operating Partnership from these properties each month. This business model enables substantial exposure to upstream commodity markets while avoiding operational and capital expenditure burdens typical of working interests [S1][S6][F1].
Historical Financial Performance
Financially, Dorchester Minerals has demonstrated consistency with notable fluctuations reflecting macro commodity cycles and drilling activity shifts. The company reported net income of $57.4 million for fiscal year 2025—a marked decline of approximately 38% compared to $92.4 million in 2024 [F1]. This downtrend corresponds largely to lower overall industry realized oil prices during the period coupled with declines in volumes from its NPI properties due to dampened drilling activity notably in the Bakken region.
Operating cash flow remained relatively steady at approximately $132.5 million for 2025 versus $132.6 million the prior year indicating strong cash generation amid income fluctuations—an expected characteristic given the predominance of non-operating royalty earnings with minimal capital expenditure obligations (capex data not materially impacting CFO) [F1].
Historical performance (annual)
| FY | Net ($mm) | CFO ($mm) | Net YoY |
|---|---|---|---|
| 2025 | 57 | 132 | -38.0% |
| 2024 | 92 | 133 | -19.0% |
| 2023 | 114 | 140 | -12.6% |
| 2022 | 131 | 147 |
Note: Omitted columns lack sufficient annual XBRL coverage in the provided tags (need ≥2 annual points): Rev, OpInc, Capex, Div, Buybacks, FCF, ROE%. Source: SEC companyfacts cache [F1].
Note: Operating income figures are not available for recent years; capex details are sparse but appear nominal relative to operating cash flows.
Drivers of Past Performance
The primary drivers behind Dorchester’s financial results include:
- Commodity Price Levels: Oil price volatility significantly influences realized revenues since payout depends directly on production value.
- Operator Drilling Activity: Reduced rig counts or suspended drilling notably depress volumes under Dorchester’s royalties—illustrated by decreased activity in Bakken NPI assets.
- Acquisitions: Strategic additions of mineral acres have bolstered volume exposure where producers accelerate development (e.g., recent Colorado acquisitions).
- Lease Bonuses: Incremental income from leasing undeveloped minerals contributes marginally but helps diversify revenue base.
In fiscal year 2025 Dorchester began receiving payments on over 761 gross new wells covering diverse regions such as Permian Basin and Rockies—even as NPI volumes declined owing to operator spending choices [S1].
Growth Prospects
Looking ahead, Dorchester’s growth hinges on several vectors:
- Development Activity: Continued operator-driven exploration and infill drilling can increase volumetric production from existing royalty acreage.
- Accretive Acquisitions: The partnership targets inorganic growth by acquiring additional mineral or overriding royalty interests usually priced attractively relative to production potential—executed primarily through equity issuance since leverage is restricted [S22][S8].
- Leasing Activity: Expanding leased acreage provides potential future royalties though this remains influenced by market conditions.
However, growth is capped by factors including:
- Capital Structure Constraints: Prohibition on incurring material debt (capped strictly below $50k actual debt) limits traditional credit-fueled expansion though equity offerings provide an alternative [S4][S8].
- Lack of Operational Control: Dorchester cannot compel operators to drill or develop nonproducing lands; decisions depend fully on third parties' budgets and strategies.
- Commodity Price Volatility: Sustained downturns could pause drilling programs or force shut-ins reducing near-term royalties.
- Regulatory Risks: Environmental laws tightening or litigation outcomes (such as around Dakota Access Pipeline impacting Bakken logistics) might delay development or increase costs borne downstream affecting production volumes [S19][S21].
These factors frame Dorchester’s tradeoff between stable yield management against cyclical energy markets.
Capital Allocation & Financial Returns
Dorchester prioritizes providing attractive unitholder yields—as formalized in its partnership agreement requiring distributions equal to 100% of available cash each quarter after reserves for operations or acquisitions. Total distributions amounting to $132 million were paid in fiscal year 2025 consistent with past practices despite earnings decline [S7][S9].
The firm generates robust operating cash flows (~$132 million per annum recently), with negligible capital expenditure requirements given its non-operated status—a key reason for high free cash flow conversion from operating activities [F1]. This allows for fully funded distributions alongside opportunistic acquisitions.
Importantly:
- No separate dividends or share buybacks beyond quarterly distributions are disclosed.
- Return on Equity (ROE) metrics are not specifically provided publicly due to limited partnership structure complexities.
- The absence of leverage enhances financial flexibility but constrains large-scale rapid expansion amid acquisition competition [S4].[F1]
Industry & Regulatory Context
Upstream sector sensitivity to global supply-demand dynamics exposes royalty owners like Dorchester Minerals to pronounced revenue swings absent operational offsets possible for direct producers. Moreover, reliance on midstream infrastructure—such as Dakota Access Pipeline critical for Bakken Basin—adds logistical vulnerability exacerbated by ongoing legal challenges.
Environmental mandates governing well plugging, water protection, emissions control increasingly burden operators potentially slowing investment pace impacting royalties indirectly.
Rising inflationary pressures on operators raise operating costs which may curtail field activities despite favorable commodity prices.
Risks Summary
Key risk factors include:
- Commodity Price Volatility: Sudden price drops reduce operator economics causing production declines directly impacting distributions.[S10]
- No Operating Control: Absence of influence may lead to delayed or suspended development undermining reserve replacement.
- Regulatory & Legal Exposure: Compliance costs plus uncertain outcomes from lawsuits can negatively affect acreage usage or transport capabilities.[S19]
- Tax Complexity & Limited Service Providers for K-1 Processing: Potential administrative hurdles may impact investor experience.[S16]
- Environmental & Climate Change Risks: Increasingly onerous standards could indirectly depress upstream activities.
Near-Term Catalysts & What To Watch
Absent explicit guidance beyond normal disclosures [N2], investors should monitor:
- Trends in commodity prices influencing operator capex plans particularly in core regions.
- Leasing activity ramp-ups indicating monetization potential in undeveloped minerals.
- Acquisition announcements reflecting strategic growth execution.
- Regulatory developments—particularly related to pipeline operations impacting Bakken deliveries.
- Quarterly distribution announcements revealing cash flow stability amid fluctuating earnings environment.[N2]
Benchmarking quarterly operational well count data alongside acreage additions can provide advance signals about underlying asset productivity trends.
Conclusion
Dorchester Minerals remains a unique player focused on generating attractive income via diversified mineral and net profits interests without operational exposure or indebtedness. While its conservative capital structure preserves financial resilience amid volatile commodity markets, its lack of operator control introduces variability linked heavily to external exploration trends and regulatory environments. Growing through accretive acquisitions financed by equity issuance complements organic growth driven by enhanced production from active basins like Rocky Mountains formations offsetting softened activity elsewhere such as Bakken during recent cycles. Yield-focused distributions underpin investor returns but remain subject to inherent cyclicality risks tied closely to global energy demand-supply dynamics and legislation governing energy infrastructure.
Disclaimer: This analysis is based solely on information publicly available as of February 24, 2026, including SEC filings and news releases cited herein without extrapolation or speculative inputs beyond noted industry context analyses. No investment advice or recommendation is intended or implied.
Disclaimer: This is research-only, informational analysis and not investment advice. It may include AI-generated interpretation and general industry context. Always verify important details using primary sources.

Comments