
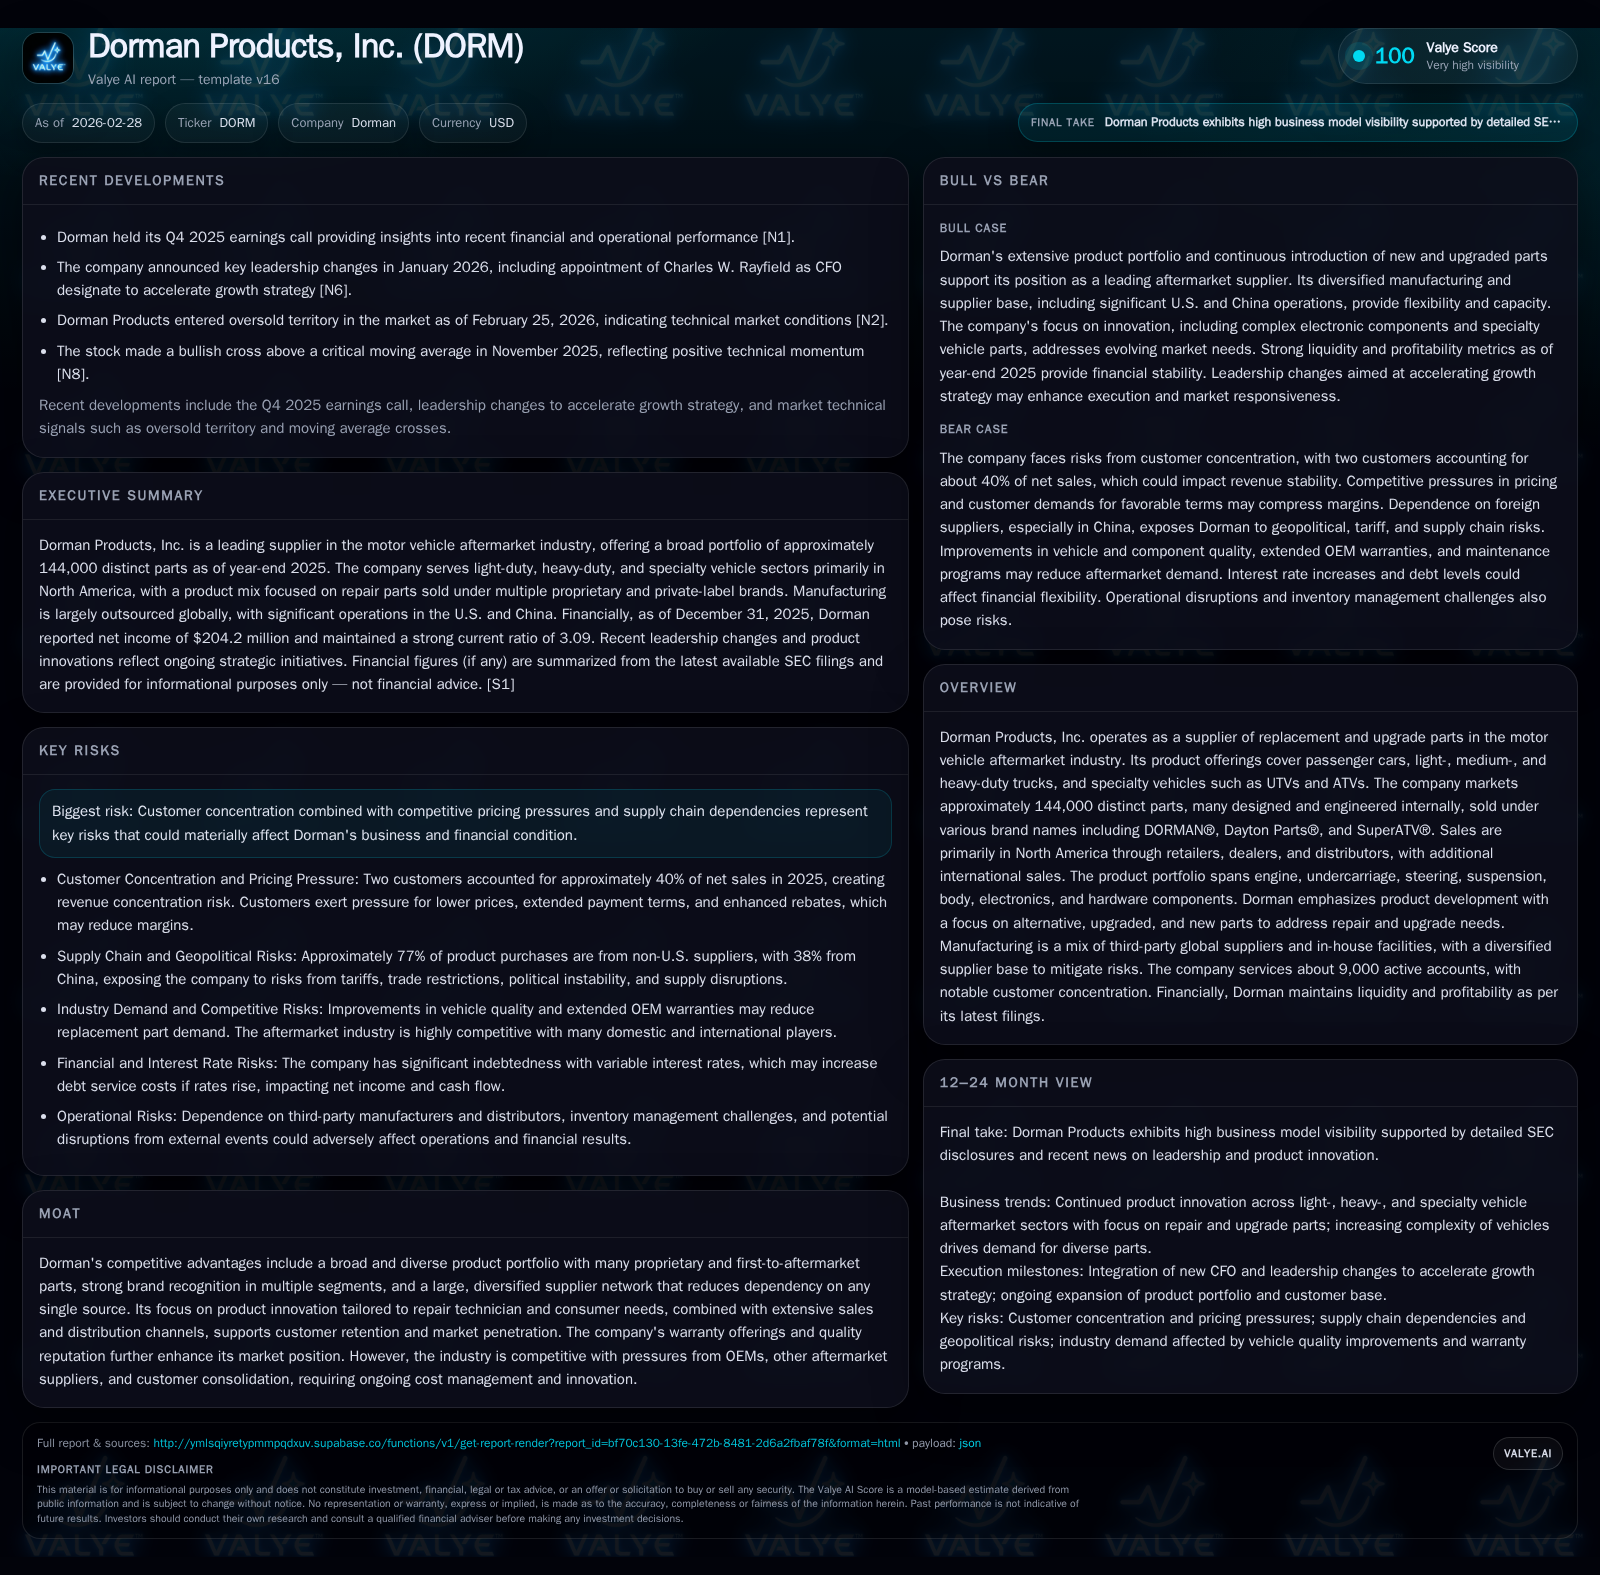
Dorman Products Advances Product Innovation Amid Customer Concentration and Competitive Pressure
Dorman balances expansive product development and supplier diversification to sustain growth amid key risks.
Dorman Products, Inc. maintains a strong position in the motor vehicle aftermarket through a broad portfolio of internally designed parts and an extensive supplier network. While revenue growth has faced modest fluctuations, operational efficiencies have driven improving profitability. However, escalating customer concentration—two buyers account for roughly 40% of sales—and competitive pricing pressures pose challenges. Supply chain diversification and focused innovation in light-, heavy-duty, and powersports segments underpin future growth prospects, even as capital allocation remains constrained by debt covenants and a cautious approach to shareholder returns.
Historical Revenue and Profit Growth: Trends and Key Drivers
Dorman Products’ financial history from FY2017 through FY2025 reveals a nuanced narrative of relatively flat top-line figures juxtaposed with solid profitability improvements. Revenue peaked marginally at approximately $228 million in FY2017 but recorded slight contraction thereafter, reflecting competitive pressures and market headwinds [F1]. Despite this stagnation in revenue growth (a -0.6% decline YoY into FY2017), operating income advanced from $171 million in FY2022 to nearly $300 million by FY2025, evidencing operational leverage and efficiency gains across the company’s production and distribution network. Net income roughly doubled over the same period reaching over $204 million in the latest fiscal year, while operating cash flow simultaneously experienced significant volatility—most notably a steep drop of approximately 50.8% YoY into FY2025 despite positive free cash flow generation of nearly $76 million after capital expenditure outlays [F1].
Such trends illustrate Dorman's ability to manage costs during top-line pressures, partially offsetting pricing elasticity challenges through structured innovations and supply chain management initiatives. Capital expenditure levels remained stable around mid-$30 million annually over recent years without considerable spikes that might suggest aggressive capacity expansion.
Historical performance (annual)
| FY | Net ($mm) | CFO ($mm) | OpInc ($mm) | Capex ($mm) | Net YoY |
|---|---|---|---|---|---|
| 2025 | 204 | 114 | 300 | 38 | +7.5% |
| 2024 | 190 | 231 | 293 | 39 | +47.0% |
| 2023 | 129 | 209 | 215 | 44 | +6.3% |
| 2022 | 122 | 42 | 171 | 38 |
Source: SEC companyfacts cache [F1].
Capital returns and efficiency (annual)
| FY | FCF ($mm) | ROE% |
|---|---|---|
| 2025 | 76 | 13.8 |
| 2024 | 192 | 14.7 |
| 2023 | 165 | 11.1 |
| 2022 | 4 | 11.7 |
Source: SEC companyfacts cache [F1].
Data reflects stabilization of revenue with growing operational profits suggesting efficiency improvements despite downward pressure on cash flows from operations[F1].
Expanding Product Lines and R&D Focus: Innovation as a Differentiator
Integral to Dorman’s long-term strategy is robust product innovation targeting emergent needs within the aftermarket space — particularly first-to-aftermarket parts which often substitute OEM alternatives or salvage yard inventories with upgraded solutions appealing to professional installers and DIY customers alike [S1][F1]. The expansion from about 138,000 distinct parts in December 2024 to approximately 144,000 at the end of December 2025 signifies sustained SKU proliferation supporting broader market penetration.
Approximately three-quarters (76%) of these products are branded under Dorman’s owned labels such as DORMAN®, Dayton Parts®, SuperATV®, HELP!, OE FIX™, and Conduct-Tite®, which collectively cater to diverse segments encompassing engine parts, suspension components, complex electronics modules including tire pressure monitoring sensors and exhaust gas recirculation coolers—items traditionally constrained to OEM or salvage acquisition channels [S1][S13]. The remainder mainly consists of customer private-label SKUs or bulk items.
This blend underscores a deliberate balance between proprietary brand development fostering differentiation and private-label supply accommodating large resellers' demands for tailored assortments or cost leadership packages — a nuanced approach acknowledging channel dynamics.
Furthermore, ongoing investments align with sector trends emphasizing electrification complexity requiring software-enabled diagnostic replacements that incorporate firmware updates—areas where early product introductions can capture significant installer mindshare prior to competitor entrance or OEM obsolescence mandates.
Customer Concentration Risks Against a Competitive Pricing Backdrop
A critical structural risk lies in escalating customer concentration: as of fiscal year-end 2025, two major customers individually accounted for over 10% of net sales each, cumulatively representing around 40%, forming an outsized dependency that amplifies vulnerability if purchasing behaviors shift adversely [S4][S10].
The motor vehicle aftermarket industry’s consolidation has intensified bargaining power at the distributor level, enabling demands for extended payment cycles, increased marketing allowances, enhanced rebates, rights of return on inventory, and aggressive price competition—all factors compressing gross margins unless offset by internal efficiencies or cost pass-through mechanisms [S4][S15].
Loss or downsizing in procurement volumes from one significant customer or renegotiations unfavorable to Dorman could materially reduce revenues or force margin sacrifices detrimental to profitability metrics.
Moreover, competitive pressures arise not only from peer aftermarket suppliers but also OEM-branded parts distributed via dealership service departments plus growing online platforms enhancing price transparency thereby elevating pricing elasticity.
Supply Chain Structure and Manufacturing Footprint Analysis
Dorman operates a complex sourcing model blending third-party manufacturing worldwide along with select owned facilities predominantly in the United States and China [S6]. Approximately 38% of product purchase volumes stem from Chinese suppliers—reflecting cost-effective manufacturing capabilities but exposing the company to geopolitical risks including tariffs, trade policy shifts, potential quotas, currency volatility, and logistics disruptions typical in global supply chains today [S6][S29].
More than four hundred active suppliers contribute to this network without any exceeding a single-supplier threshold above roughly 10%, demonstrating deliberate supplier diversification aimed at mitigating dependency concentration risks—a strategic moat element given industry uncertainties [S10][S21].
Nevertheless, ramping complexity due to regulatory compliance demands (e.g., anti-bribery controls), export/import restrictions affecting raw materials flow, rising freight costs exacerbated by capacity constraints among third-party logistics providers add layers of operational intricacy management must continuously navigate [S9][S28].
Persistent efforts center on qualifying alternative sources expeditiously when warranted alongside protective inventory positioning pertinent for high-demand SKUs balancing service levels against holding costs.
Capital Allocation: Cash Flow Trends, Debt Profile, and Shareholder Returns
Financial discipline is evident though tempered by capital structure constraints; Dorman ended FY2025 with total equity around $1.48 billion supporting operating income of nearly $300 million translating into an approximate return on equity (ROE) near 13.8%, signaling effective profitability for shareholders given the asset base [F1].
However, liquidity considerations reflect operational variances: while free cash flow remains positive at about $76 million after capex (~$38 million), operating cash flow fell by more than half compared to prior year indicative of working capital swings or timing differences possibly linked to accounts receivable sales programs involving discount factoring arrangements increasing financing costs under current higher interest rate environments [F1][S8][S17].
On the debt front, Dorman holds $440.6 million outstanding term loans backed by Bank of America due October 2027 alongside an unused revolving credit line of $600 million which provides some financial flexibility though is subject to covenants restraining aggressive capital deployment strategies including stock repurchases or dividend resumption—none have occurred meaningfully since dividend payments ceased post-FY2014 reflecting prudent risk mitigation amidst uncertain macroeconomic backdrop [F1][S5].
Thus far share repurchase activity is nominal dating back several years depicting a conservative stance aligned with maintaining investment-grade credit profiles while supporting strategic investments.
Leadership Changes Impacting Strategic Direction
In January 2026 announcements detailed key leadership transitions intended to accelerate growth execution focusing on innovation pipeline enhancement amidst competitive challenges; while specifics are limited beyond executive position realignments their stated objectives include sharpening product development focus coupled with strengthening commercial strategies directed at expanding market share across core segments [N6].
Such moves represent proactive governance recognition that sustaining momentum amidst intensifying pricing pressures requires fresh strategic impetus possibly affecting forthcoming R&D prioritization frameworks or channel engagement tactics without speculative extrapolation beyond disclosed information.
Assessing Future Opportunities in Light-, Heavy-Duty, and Powersports Segments
Dorman addresses a sizable combined total addressable market exceeding $165 billion spanning three motor vehicle aftermarket sectors: light-duty vehicles including passenger cars/trucks; heavy-duty comprising medium/heavy commercial trucks; plus specialty powersports vehicles such as UTVs/ATVs targeting both functional repair parts and discretionary upgrade accessories [S14][S16][S21].
Repair parts constitute majority sales being nondiscretionary necessities tied to vehicle safe operation whereas discretionary categories correlate more strongly with consumer spending cycles offering upside potential during economic expansions but elevated cyclicality risk during downturns.
Technological complexity escalation especially in electronics integration further carves niches within light-duty markets requiring sophisticated diagnostics-driven parts—a segment seeing sustained investment reflected by new modular components launched recently such as active grille shutters or chassis control modules designed specifically for professional installers seeking time-saving OEM fix alternatives [S13].
Heavy-duty markets reveal opportunities in branded air tanks, consolidated brake kits targeting fleet operators preferring reliability combined with reduced service time while powersports expansions include proprietary coatings enhancing durability aligned with off-road conditions plus advanced tread designs balancing traction/performance trade-offs supportive of growing recreational vehicle ownership trends.
Nonetheless these potentials face moderation from evolving OEM warranty extensions and improved new vehicle component quality potentially dampening replacement part frequencies posing structural challenges ahead requiring continuous innovation refreshment.
What to Watch: Market Dynamics and Potential Milestones
Investors should closely monitor upcoming quarterly earnings releases post-FY2025 results highlighting recovery trajectories especially examining margin resilience versus peer LKQ’s recent underperformance signalling broader sector headwinds as well as cadence of new product introductions validated by growing wallet share gains among large customers [N1][N2][N4].
Supply chain adaptability amid tariff fluctuations remains a pivotal focal point particularly tracking duration impacts related to Chinese import dependencies vis-à-vis alternative sourcing efforts showcased prominently within investor disclosures alongside any incremental operating expense volatility attributable thereto.
Renewal patterns for major customer contracts will indicate whether pricing pressures intensify or stabilize—the negotiation outcomes critically influence margin outlooks given dominant customers’ negotiation leverage coupled with consolidation trends diminishing reseller count constraining options available for Dorman beyond current largest buyers [N3][N5][S15].
Regulatory developments affecting product safety standards or intellectual property enforcement disputes represent latent risk vectors that could trigger compliance cost escalations or litigation expenses consequently influencing operational performance metrics absent forward guidance disclosure.
In summation Dorman Products embodies a mature aftermarket player effectively leveraging extensive SKU breadth alongside supplier diversity but continually contends with structural challenges emanating from concentrated customer base risks compounded by rigorous competitive pricing dynamics necessitating vigilant innovations complemented by prudent financial management.
Disclaimer: This is research-only, informational analysis and not investment advice. It may include AI-generated interpretation and general industry context. Always verify important details using primary sources.
Comments