
Driven Brands Accelerates Franchise Growth While Managing High Leverage Burden
Driven Brands' May 2026 update underscores robust franchise unit expansion and operational scaling despite significant leverage constraints.
Driven Brands Holdings Inc. reported a strategic commitment to opening over 1,000 new franchised locations, marking a substantial expansion in its automotive services footprint across North America. The company’s business model blends franchised and company-operated units, leveraging data analytics and shared services to optimize margins. However, its financial profile remains challenged by a heavy debt load nearing $2.2 billion, necessitating careful management of liquidity and covenant terms. Growth drivers center on franchise economics, brand recognition, and expanding service portfolios, while key risks include refinancing execution and evolving competitive landscape dynamics.
Latest Strategic Developments Highlighted in May 2026 8-K
Driven Brands' recent filing dated May 19, 2026 ([S3]) asserts a robust growth trajectory anchored by signed agreements to open over 1,000 new franchised units. This sizable pipeline provides concrete visibility into unit-level expansion that underpins medium-to-long term revenue growth expectations. The update also coincides with ongoing operational efficiency initiatives designed to leverage shared services at scale. This development matters as it showcases confidence from franchise partners in the Driven Brands platform despite existing market uncertainties and financial leverage pressures. The recommitment to network expansion directly supports sustained same-store-sales momentum reported in prior quarters [N1], while aligning with the overall strategy to deepen penetration across fragmented automotive service segments.
Overview of Driven Brands’ Business Model and Brand Portfolio
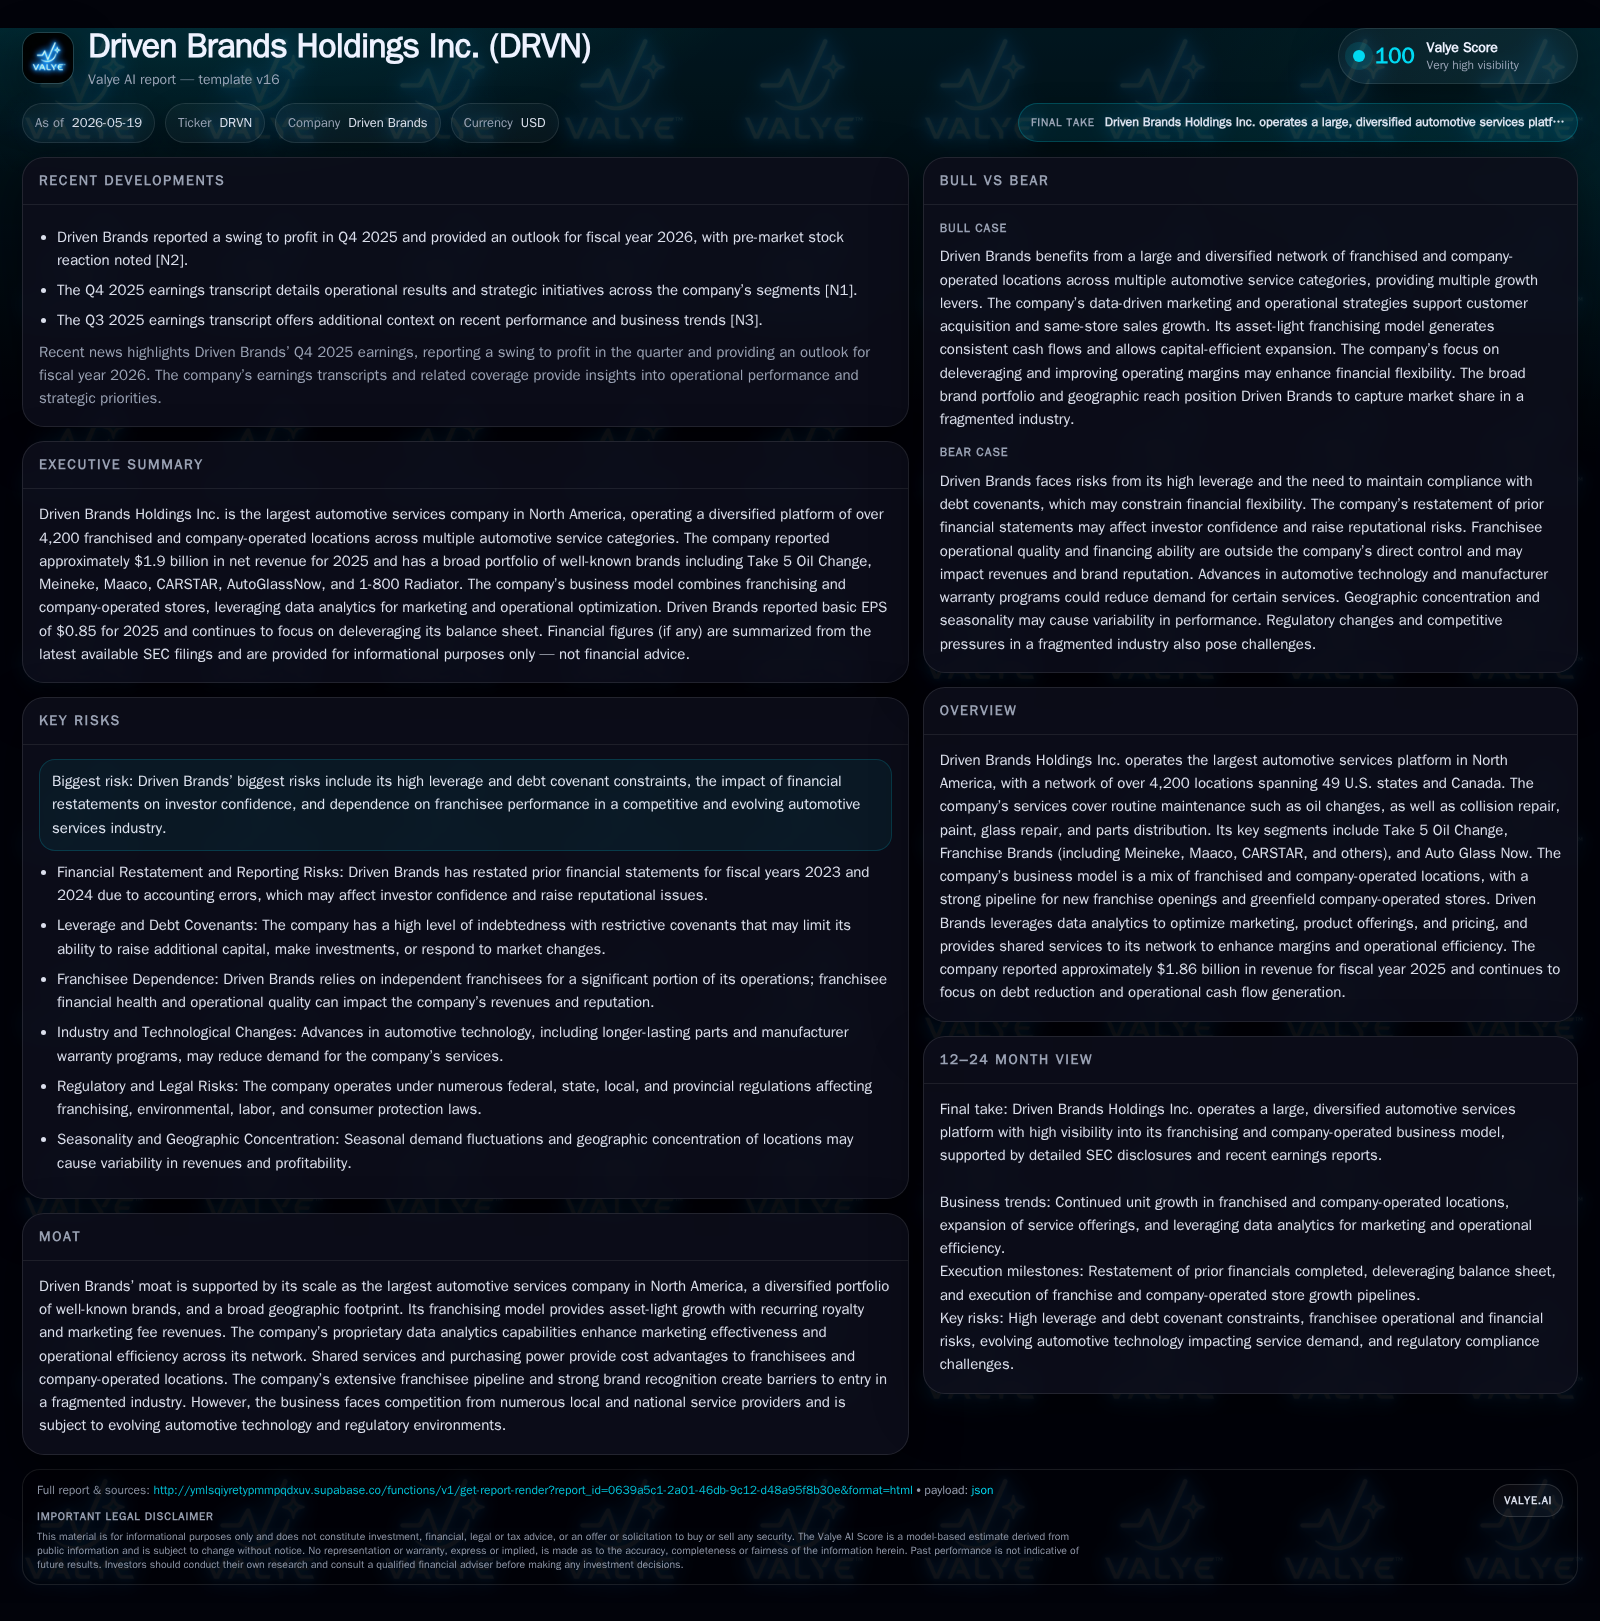
Driven Brands operates as North America's largest automotive services platform with over 4,200 locations spanning nearly all U.S. states and Canada ([S1],[F1]). Its business model uniquely combines franchised operations — which provide recurring royalty streams and an asset-light growth profile — with company-operated stores that allow direct control over select markets. Key brands include Take 5 Oil Change (a quick-service oil change concept with both franchised and owned outlets), Meineke (comprehensive maintenance/repair), Maaco (collision/paint), CARSTAR (collision repair), Auto Glass Now (mobile glass repair/replacement), among others.
Revenue arises from customer payments for automotive maintenance or repair services rendered at these locations. Franchisees contribute through royalties based on revenues plus mandatory marketing fund contributions. Company-operated units drive top-line directly but incur greater capital intensity. Margins are enhanced by economies of scale via shared services such as procurement, technology platforms for CRM/marketing, and centralized training programs. Data analytics play a strategic role in optimizing pricing and product assortments tailored to local demand dynamics.
Industry Competition and Positioning within the Automotive Services Sector
The North American automotive aftermarket is highly fragmented with myriad local independent operators alongside national chains ([S1],[S14]). Competitors range from traditional repair shops to dealership service centers to specialized quick-lube providers. Customer switching costs are moderate but favored recognized brands offering convenience, consistency, and integrated commercial/insurance solutions.
Driven Brands' significant scale results in cost advantages through purchasing power combined with broad geographic coverage supporting commercial fleet and insurer contracts — sectors demanding reliable multi-location service providers ([S26]). Its multi-brand portfolio enables cross-segmentation capturing diverse customer needs across routine maintenance through collision repair and glass replacements.
Compared to peers without similar scale or breadth (e.g., regional chains or single-category specialists), Driven Brands benefits from diversified revenue streams reducing earnings volatility linked to seasonal or economic cycles prevalent in automotive servicing.
Data-Driven Operational Advantages and Franchise Economics
Operating efficiency gains derive substantially from proprietary data analytics capabilities ([S1]). These tools guide site selection for new store openings maximizing local market potential while minimizing cannibalization risk within existing footprints ([S25]). Marketing funds—partially contributed by franchisees—enable targeted promotional initiatives refined through lead analytics enhancing customer acquisition and retention.
Take 5 Oil Change exemplifies this approach with its lean store layout featuring compact design that reduces upfront capex (due to minimal real estate needs) while facilitating rapid throughput resulting in attractive unit-level economics ([S1]). Shared services also deliver cost savings on supplies and administrative overhead enhancing margins across both franchised and company-owned channels.
Such integrated technological support creates barriers for smaller independents lacking scale or systems sophistication to compete effectively on price or service consistency.
Growth Drivers Centered on Franchise Pipeline and Market Penetration
Growth vectors pivot around two main engines: aggressive franchising complemented by selective company-operated openings ([S3],[S25]). The signed pipeline exceeding 1,000 new franchised outlets signals strong market demand from prospective franchisees seeking affiliation benefits such as brand equity, insurance partnerships, purchasing discounts, and operational support.
Additionally, Driven Brands pursues conversions of independent operators who benefit economically by joining the network platform — gaining brand recognition and access to shared resources absent in their standalone models ([S1]). This combination accelerates store count growth beyond organic build alone.
New product introductions (e.g., expanded coolant services at Take 5) further elevate spend per visit while Auto Glass Now expands flexible mobile glass repair options capturing insurance claim flows ([S1]). Repeat customer visits are driven by convenient service formats supporting frequent maintenance needs.
Margins may benefit from scaling company-operated stores due to greater direct control over operations despite higher capex compared to franchising.
Risks from Financial Leverage, Franchise Performance, and Industry Evolution
Driven Brands faces significant risk concentration around its elevated indebtedness profile: total debt approximates $2.19 billion versus cash levels near $103 million ([F1],[S4],[S5]). Covenants attached to securitized notes impose stringent restrictions on asset sales, acquisitions, dividends, additional borrowings, liens, and related-party transactions ([S4],[S21]). Failure to meet financial covenants could trigger rapid amortization of securitized debt severely impairing liquidity.
Franchise dependence presents operational risk wherein inconsistent adherence to quality or trademark standards could dilute brand reputation impacting demand ([S21],[S14]). Technological advances in vehicle complexity may reduce certain routine maintenance volumes or shift parts/service needs requiring continual adaptation ([S1],[S14]). Regulatory compliance including labor laws across jurisdictions adds potential cost volatility.
These factors collectively necessitate disciplined balance sheet management alongside proactive franchise support programs ensuring network performance aligns with corporate standards.
Milestones and Indicators to Monitor for Execution and Demand Trends
Key indicators include the pace at which contractual commitments for new franchise unit openings translate into actual store launches ([S3]), franchisee profitability metrics reflecting unit economics stability or improvement ([N1]), margin expansion via deeper shared services penetration across newly onboarded stores ([S25]), updates provided around debt covenant compliance or amendments signalling financial flexibility status ([S3],[N5]).
Additional focus areas encompass consumer adoption trends especially for emerging add-on products or mobile service capabilities driving wallet share gains within existing customer bases.
Concise Financial Profile Supporting Growth versus Leverage Balance
Driven Brands recorded fiscal year ending December 27, 2025 revenue nearing $1.86 billion with operating income approximately $78 million ([F1]). The net income reported reflects legacy net losses at end-2024 indicating earnings volatility possibly tied to restructuring or financing adjustments ([F1]).
The balance sheet highlights a high leverage environment with total debt around $2.19 billion offset minimally by cash balances near $103 million producing a net debt position exceeding $2 billion ([F1]).
Despite solid cash flows generated from operations supporting debt repayments including proceeds from divested car wash assets; refinancing execution remains crucial given covenant-imposed restrictions on capital allocation ([S13],[S18],[S27]).
This analysis is based solely on publicly available information up to May 19, 2026 including SEC filings, recent news transcripts, and XBRL-derived financial data [F1]. It does not constitute investment advice or research views.
Disclaimer: This is research-only, informational analysis and not investment advice. It may include AI-generated interpretation and general industry context. Always verify important details using primary sources.

Comments