
Devon Energy Accelerates Growth with Coterra Merger and Focused Capital Discipline
Devon Energy advances its strategic transformation through a major merger and disciplined execution in liquids-rich U.S. basins.
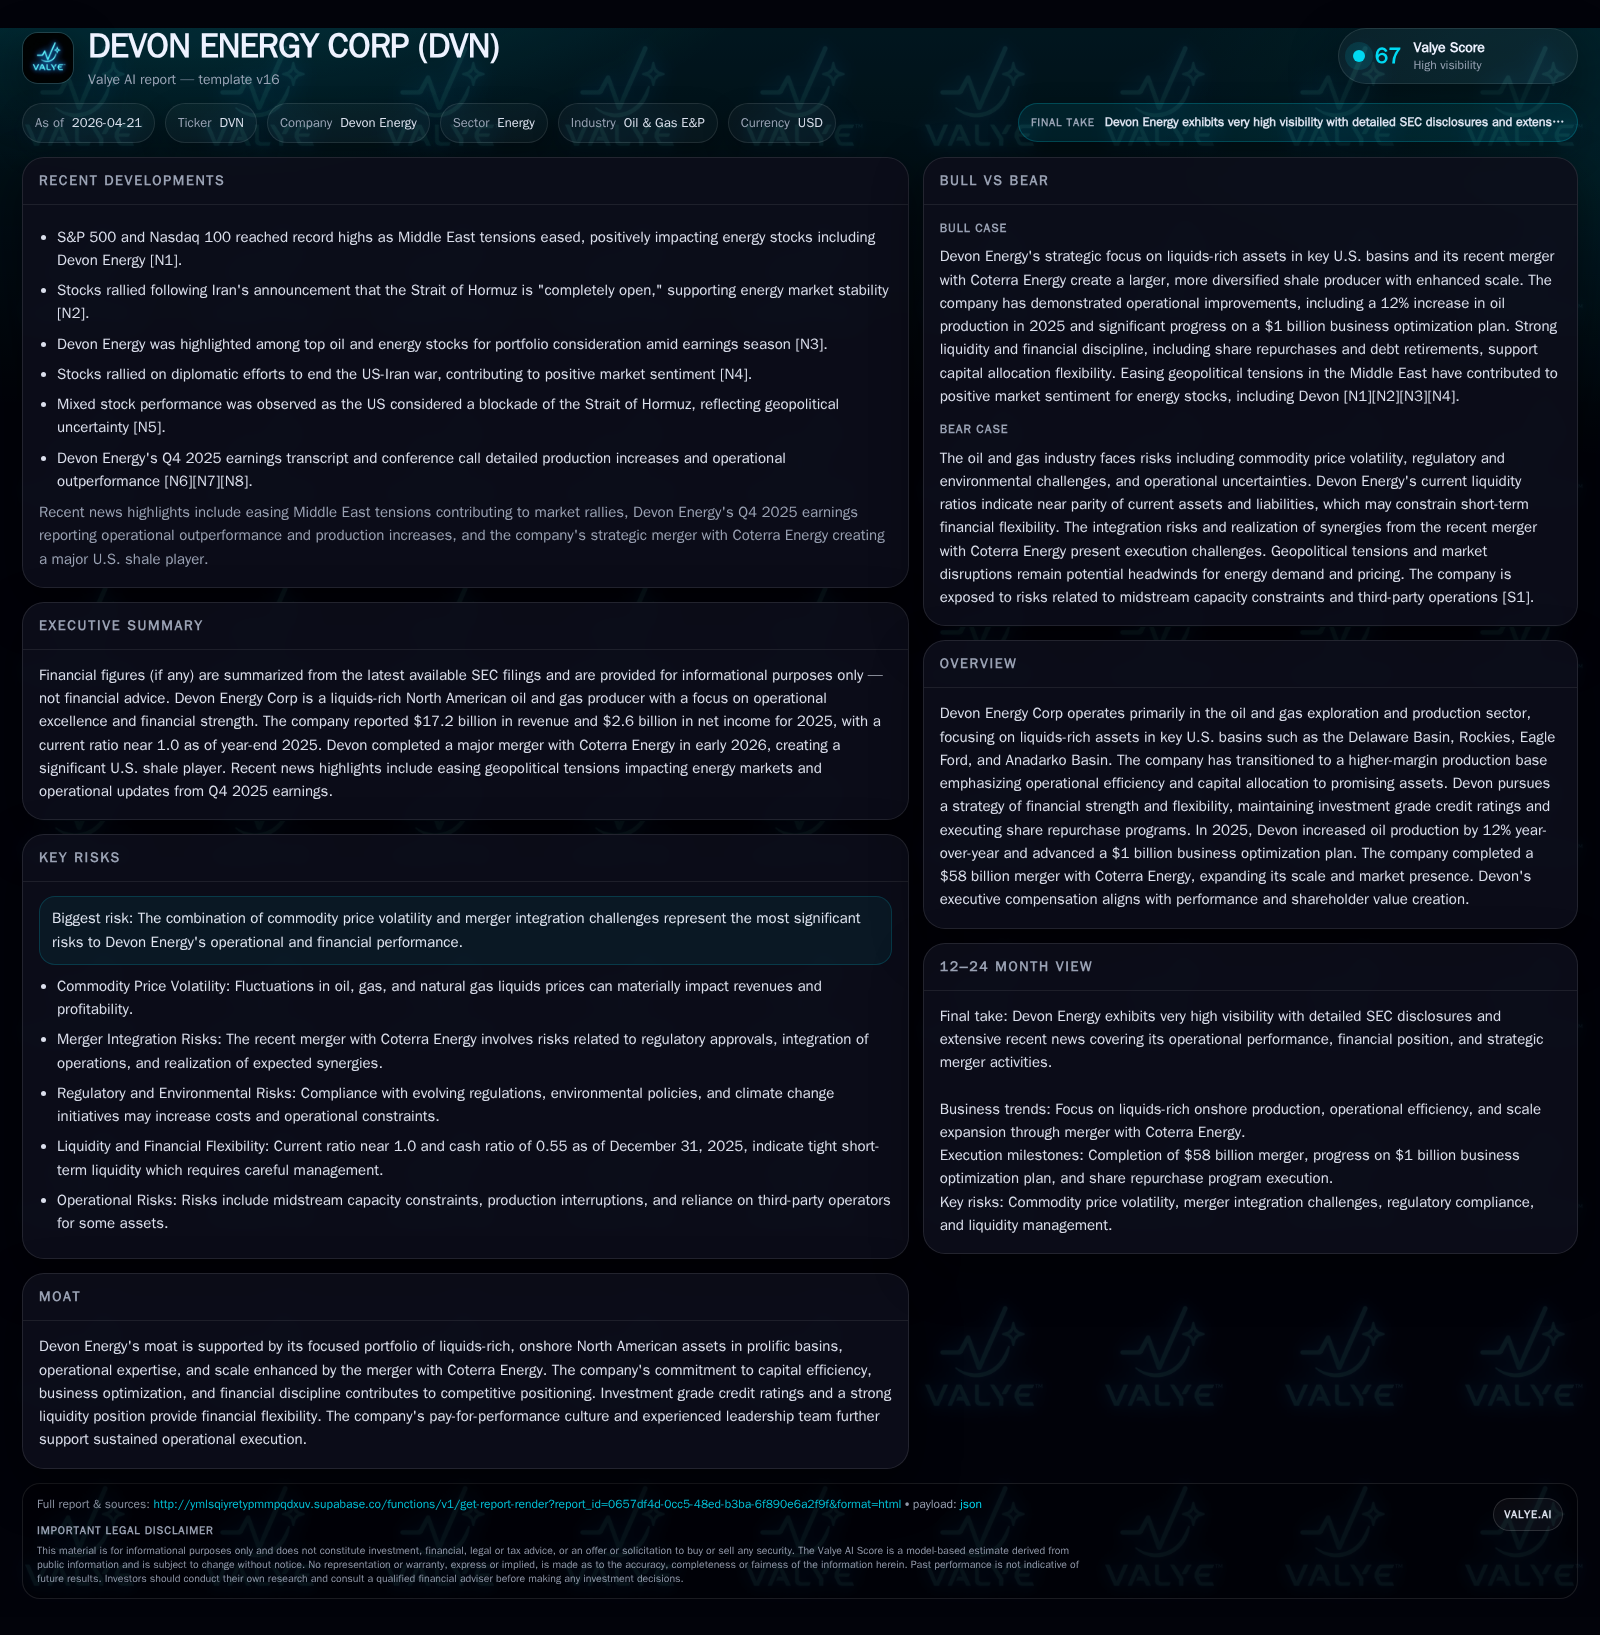
Devon Energy's latest developments center on its pending $58 billion merger with Coterra Energy, complementing a strong operating performance driven by a liquids-focused asset base in prolific U.S. shale plays. The company continues to prioritize capital efficiency, operational excellence, and shareholder returns by expanding scale, optimizing operations, and maintaining financial flexibility. Key growth drivers include increased oil production volumes, integration synergies from the merger, and continued business optimization efforts. Risks remain from commodity price volatility and integration hurdles. Financially, Devon has reported solid operating cash flow and liquidity as it executes an aggressive share repurchase program alongside retiring debt.
Recent Operating Update
Devon Energy’s most consequential recent development is the proposed merger with Coterra Energy announced earlier in 2026 [S3][S15][S26]. The transaction, valued around $58 billion, will see Coterra become a wholly-owned subsidiary of Devon upon closing, expected in Q2 2026 following antitrust approvals including clearance under the Hart-Scott-Rodino Act [S15]. This expansion substantially increases Devon's scale across higher-margin liquids-rich U.S. basins.
Operating results prior to the merger demonstrate a firm trajectory: for the full year 2025, Devon increased oil production by 12% year-over-year to roughly 389 thousand barrels per day (MBbls/d), reflecting strengthened upstream execution and advancing its business optimization initiatives which were approximately 85% complete [S9]. This optimization included targeted asset sales generating over $545 million in proceeds and the acquisition of noncontrolling interests in midstream investments to tighten integration [S9].
Financially, Devon exited the year well-capitalized with $4.4 billion of liquidity composed of $1.4 billion in cash equivalents [S9][F1]. The company generated operating cash flow (CFO) exceeding $6.7 billion for the year—demonstrating strong free cash flow generation given moderate capital expenditures—and retired nearly half a billion dollars ($485 million) in senior notes to optimize its debt profile ahead of the merger [S9]. Furthermore, Devon has aggressively repurchased shares: executing about 88% of an authorized $5 billion share buyback program by repurchasing approximately 100 million common shares at an average price near $44 per share [S9].
The credit agreement was amended in March 2026 to extend maturity from 2030 to 2031 while removing certain credit spread adjustments, enhancing financial flexibility during this pivotal corporate evolution [S4][S18].
Business Model and Strategic Position
Devon Energy operates primarily as an upstream oil & gas exploration and production company concentrated on high-return, liquids-rich plays across key U.S. basins such as the Delaware Basin, Rockies, Eagle Ford Shale, and Anadarko Basin [S1]; these assets promise better margins relative to gas-heavy portfolios amid ongoing global shifts toward oil demand recovery.
The company generates revenue predominantly from crude oil and natural gas liquids production supplemented by natural gas sales and marketing activities [S1]. It also benefits from selective midstream operations ownership that provides integrated logistics advantages.
Post-merger with Coterra—also focusing on liquids-centric assets—Devon aims to leverage greater scale for enhanced operational efficiency via synergy realization. The combined entity's operating model emphasizes diligent capital allocation prioritizing high-return projects over growth for growth's sake. This approach is embedded into governance via a pay-for-performance philosophy aligning executive incentives closely with operational metrics such as total shareholder return (TSR), cash flow generation, and operational excellence [S21][S22].
Operational strengths include deep technical expertise in hydraulic fracturing and reservoir management enabling efficient resource extraction at competitive costs. The deliberate emphasis on onshore U.S. development limits exposure to geopolitical risk while allowing management to concentrate on optimizing production profiles.
Industry Structure and Competitive Position
The North American upstream oil sector remains intensely competitive but structurally favors operators with scale combined with liquidity and portfolio quality . Devon’s portfolio is notable for its mix of premier unconventional plays yielding attractive liquids uplift — an important factor given premium pricing dynamics for light crude over heavier grades.
Competitors include other large independent E&Ps like EOG Resources and ConocoPhillips who equally focus on scale-driven production optimization amid commodity price cycles. However, Devon’s recent combination with Coterra differentiates it by creating a larger enterprise allowing more pronounced capital deployment flexibility.
Midstream capacity constraints persist as an industry-wide bottleneck affecting takeaway for some shale regions; Devon partially mitigates this risk through ownership stakes in upstream-connected midstream assets helping to stabilize logistics costs [S9].
Environmental regulations represent an external constraint shaping ongoing investment decisions. Devon pursues sustainability initiatives aiming to balance operational footprint reduction while sustaining production growth—aligning with investor ESG expectations without impairing core profitability [S24].
Growth Drivers and Constraints
Key growth drivers for Devon manifest structurally rather than cyclically:
- Asset Quality: Concentration in prolific liquids-rich basins sustains above-market margins supporting long-term value capture.
- Merger Scale: Combining with Coterra introduces economies of scale and geographic diversification potentially lowering unit operating costs.
- Capital Efficiency: Ongoing business optimization efforts reflect improved cost discipline unlocking higher free cash flow.
- Shareholder Returns: Aggressive buybacks signal confidence in sustainable cash generation underpinning enhanced per-share value.
Constraints include commodity price volatility—a perennial risk impacting realized prices despite hedging programs—and the complexities inherent in executing large-scale mergers such as integrating systems, cultures, and realizing synergistic cost reductions [S5][S7]. Additionally, regulatory scrutiny related to environmental impact or antitrust considerations may pose timing or conditioning risks around expansion plans.
What to Watch Next
Critical milestones revolve around:
- Merger Completion: Monitoring regulatory approvals beyond antitrust clearance remains vital; any delays could alter strategic timelines or deal valuation synergy assumptions [S15].
- Synergy Realization: Post-close integration effectiveness will materially influence cost structure improvements and capital deployment agility.
- Operational Metrics: Tracking oil production trends beyond the reported 12% increase to confirm sustainable output growth amid infrastructure or supply chain challenges.
- Capital Allocation Strategy: Management’s post-merger priority between further buybacks, dividend policy adjustments, debt repayment, or incremental exploration capex will provide insight into corporate confidence levels.
- Commodity Price Developments: Broader energy market conditions will decisively affect revenue streams; hedging outcomes should be assessed relative to volatility shocks.
Financial Profile
Historical performance (annual)
| FY | Rev ($bn) | Net ($bn) | CFO ($bn) | Rev YoY | Net YoY |
|---|---|---|---|---|---|
| 2025 | 17.2 | 2.9 | 6.7 | +7.8% | +0.1% |
| 2024 | 15.9 | 2.9 | 6.6 | +4.5% | -22.8% |
| 2023 | 15.3 | 3.7 | 6.5 | -20.4% | -37.7% |
| 2022 | 19.2 | 6.0 |
Source: SEC companyfacts cache [F1].
Capital returns and efficiency (annual)
| FY | Div ($mm) | Buybacks ($mm) | ROE% |
|---|---|---|---|
| 2025 | 1050 | 18.6 | |
| 2024 | 143 | 1057 | 19.9 |
| 2023 | 1858 | 979 | 31.1 |
| 2022 | 875 | 718 | 53.9 |
Source: SEC companyfacts cache [F1].
Supporting Devon’s operational story is a robust financial footing showcased by strong top-line momentum rising nearly 8% year-over-year to approximately $17.2 billion for fiscal year ending December 31, 2025 [F1]. Operating income trends are harder to isolate given legacy impairment charges but available data suggest steady improvement aligned with operational gains.
Net income was stable around $2.89 billion year-over-year while operating cash flow surpassed $6.7 billion reflecting efficient working capital management [F1]. With relatively stable capital expenditure levels supporting current production capacity plus ongoing asset rationalization strategies, free cash flow generation approached $6.68 billion on a best-effort basis calculated as CFO less capex [F1].
Balance sheet liquidity is prudent; cash plus equivalents total about $1.38 billion while current liabilities slightly exceed current assets leaving a near-neutral current ratio just under one — reflecting tight working capital positioning compatible with industry norms [F1]. Equity stands healthy at roughly $15.5 billion indicating significant net asset backing despite market fluctuations.
Capital return initiatives remain prominent:
- Nearly $1 billion involved in share repurchases during recent years accelerating per-share economic benefits;
- Dividend payments sustained though comparatively moderate versus repurchases indicating balanced shareholder return priorities;
- Debt reduction actions including senior note retirements improve credit quality ahead of larger corporate maneuvers like mergers [F1][S9][S21].
Overall leverage appears managed conservatively given investment-grade credit ratings mentioned in disclosures which underpin borrowing flexibility needed for strategic initiatives like the Coterra acquisition .
This analysis is based solely on publicly available information up to April 2026 and does not constitute investment advice or recommendations. Readers should conduct independent due diligence considering their specific objectives and risk tolerance.
Disclaimer: This is research-only, informational analysis and not investment advice. It may include AI-generated interpretation and general industry context. Always verify important details using primary sources.
Comments