
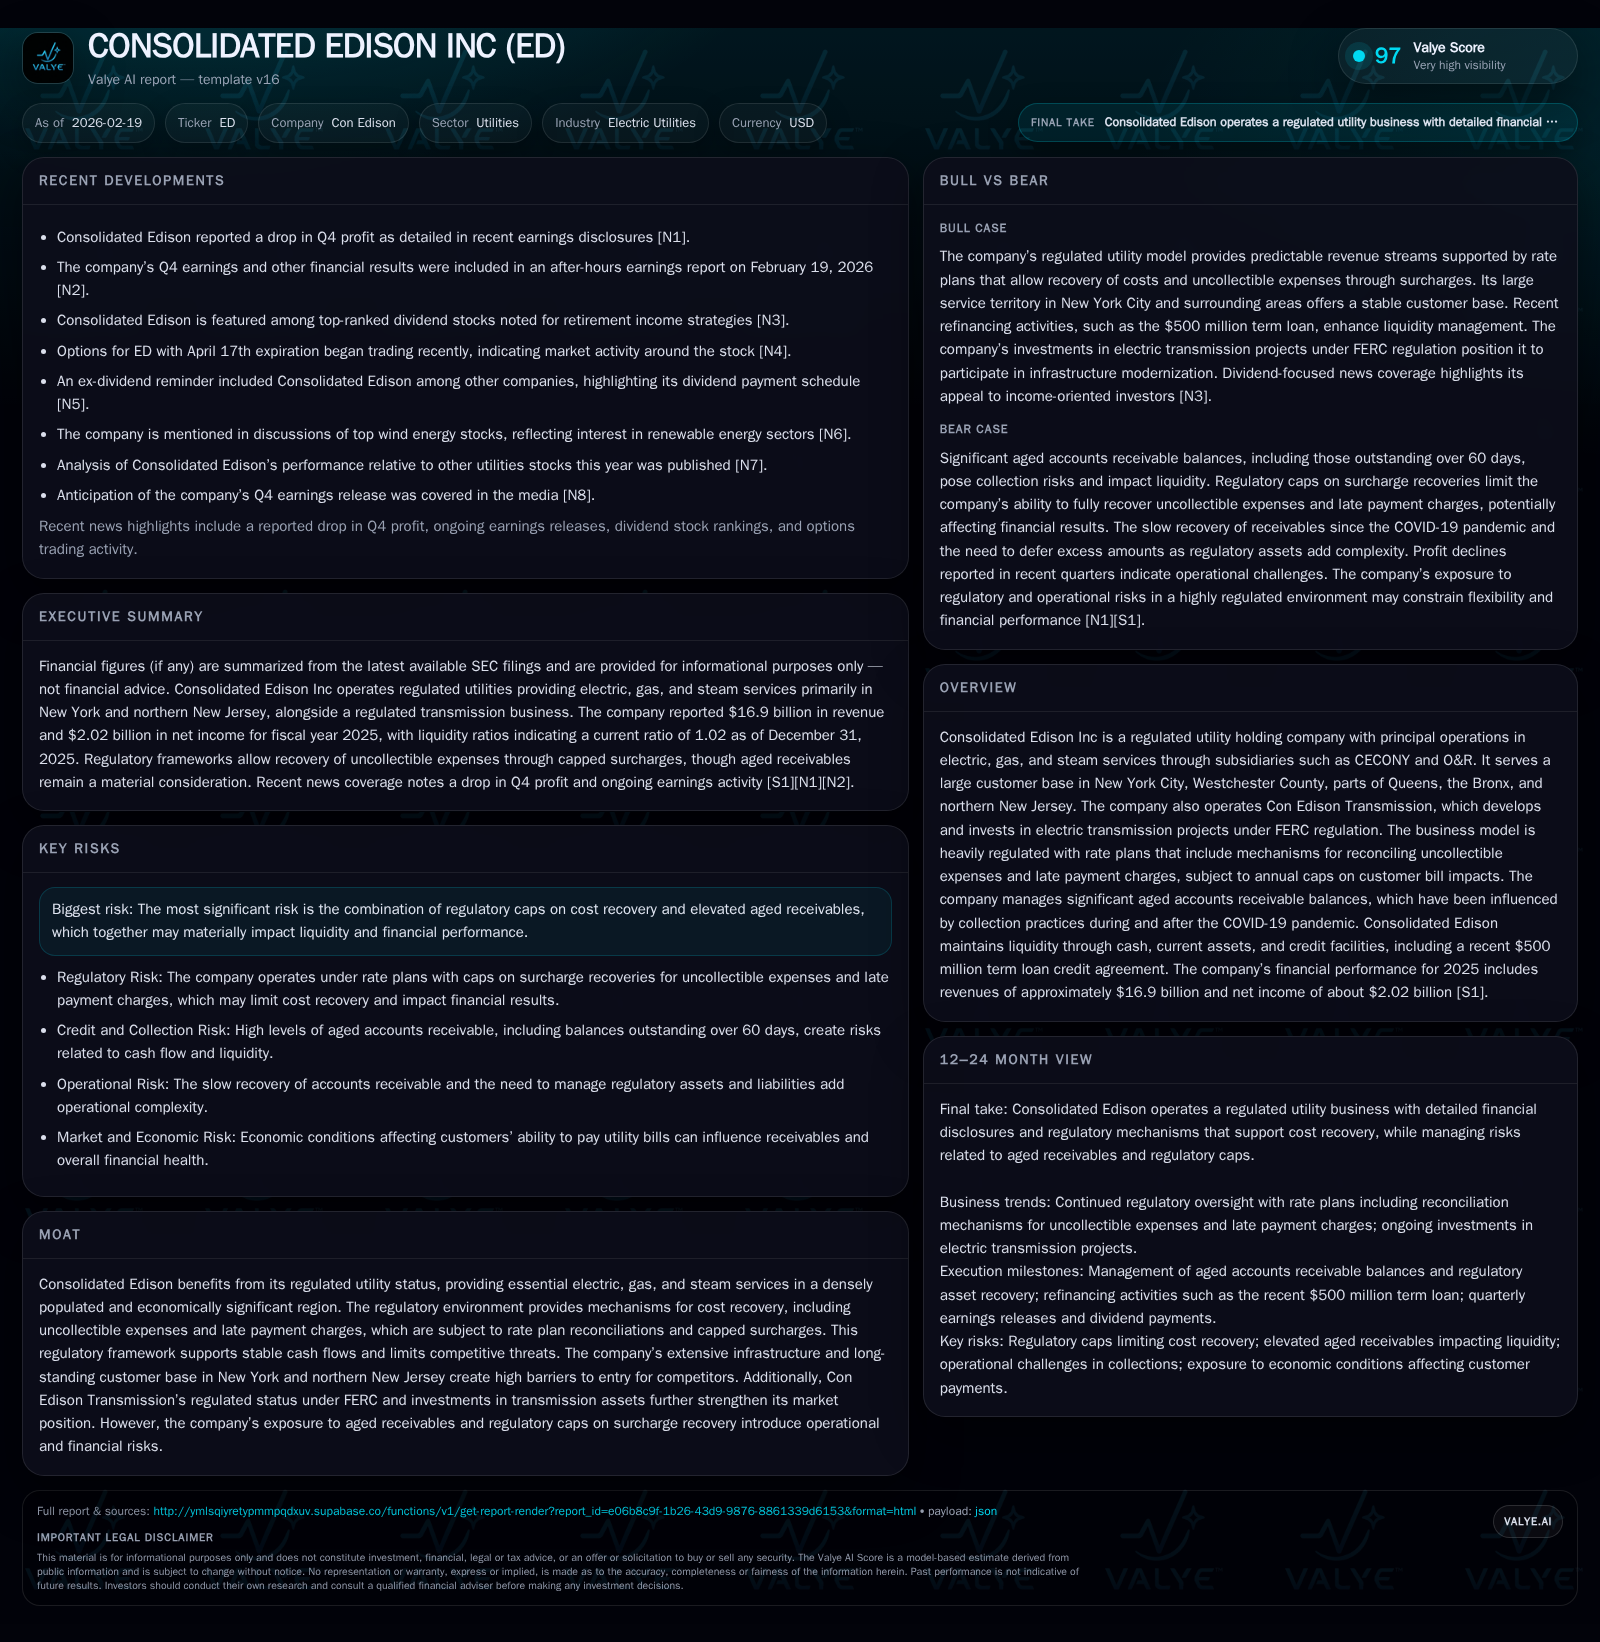
Consolidated Edison’s Regulatory Caps and Aged Receivables Shape Growth and Liquidity Outlook
A regulated utility entrenched in New York’s energy transmission faces growth opportunities amid financial recovery constraints from elevated receivables and rate plan limits.
Consolidated Edison Inc (ED) operates as a regulated utility holding company providing electric, gas, and steam services primarily in New York City and surrounding areas. Historically, the company has seen steady revenue and net income growth supported by regulatory frameworks enabling cost recovery. However, elevated aged accounts receivable resulting from pandemic-era collection disruptions combined with regulatory caps on surcharge recoveries place pressure on liquidity and cash flow variability. Looking ahead, growth relies on rate plan executions, infrastructure investments, and Con Edison Transmission’s strategic initiatives under Federal Energy Regulatory Commission oversight. While ongoing regulatory mechanisms provide some mitigation for bad debt expense, the company must navigate the balance between customer bill impact limits and recovering costs. Capital allocation remains focused on dividends with no recent share repurchases, reflecting a conservative stance amid operational uncertainties.
Company Overview and Market Position
Consolidated Edison Inc (ED) is a cornerstone regulated utility holding company operating principally through its subsidiaries CECONY (Consolidated Edison Company of New York) and O&R (Orange & Rockland Utilities). Their footprint extends across one of the most densely populated and economically vital metropolitan regions in the U.S.—New York City boroughs including Manhattan, Queens, Bronx plus Westchester County and parts of northern New Jersey [S1][S4]. This positioning grants Con Edison a deeply entrenched monopoly status buttressed by state and federal regulatory oversight.
Notably, Con Edison Transmission contributes a complementary business segment focused on electric transmission infrastructure development under Federal Energy Regulatory Commission jurisdiction. These investments align with regional grid modernization efforts but operate within stringent regulatory prudence limiting risk exposures [S4].
Historical Financial Performance
Over the past four fiscal years through 2025, the company demonstrated consistent revenue expansion driven largely by the stable regulatory frameworks providing cost-of-service recoveries alongside approved rate plans. Revenue increased from approximately $14.66 billion in FY2023 to $16.92 billion in FY2025, representing compound annual growth influenced by inflation adjustments and mandated infrastructure investments [F1]. This rise was accompanied by operating income that showed some variability but climbed back to $2.94 billion in 2025 following a dip in 2024.
Net income likewise reflected this trend with a notable surge from $1.66 billion in 2022 to just over $2 billion in 2025, though prior volatility owed partly to non-recurring items relating to pandemic impacts and regulatory settlements. Operating cash flows rebounded strongly – surging from $2.16 billion in 2023 to almost $4.8 billion last year – reflecting improved working capital management despite ongoing collection challenges [F1].
Capital expenditures have remained substantial as Con Edison maintains its aging infrastructure while investing in transmission upgrades aligned with clean energy transitions; capex approximated $4.47 billion for the latest full year available, underscoring intensive capital demands balancing operational reliability against environmental mandates.
Historical performance (annual)
| FY | Rev ($bn) | Net ($bn) | CFO ($bn) | OpInc ($bn) | Rev YoY | Net YoY |
|---|---|---|---|---|---|---|
| 2025 | 16.9 | 2.0 | 4.8 | 2.9 | +10.9% | +11.2% |
| 2024 | 15.3 | 1.8 | 3.6 | 2.7 | +4.0% | -27.7% |
| 2023 | 14.7 | 2.5 | 2.2 | 3.2 | -6.4% | +51.7% |
| 2022 | 15.7 | 1.7 | 3.9 | 2.6 |
Note: Omitted columns lack sufficient annual XBRL coverage in the provided tags (need ≥2 annual points): Capex, FCF. Source: SEC companyfacts cache [F1].
Capital returns and efficiency (annual)
| FY | Div ($mm) | Buybacks ($mm) | ROE% |
|---|---|---|---|
| 2025 | 1166 | 0 | 8.4 |
| 2024 | 1100 | 0 | |
| 2023 | 1096 | 1000 | 11.9 |
| 2022 | 1089 | 8.0 |
Source: SEC companyfacts cache [F1].
Capex for more recent years not fully tagged; prior capex averaged about $4B+ around FY22.
Note: Capex values for latest years are taken from SEC disclosure where exact tags were incomplete; detailed capex tagged data unavailable for all years.
Operating Environment and Regulatory Dynamics
A key attribute shaping Consolidated Edison's results is its regulatory environment that tightly controls prices charged to customers through formal rate plans subject to public service commissions' approval.
CECONY’s multi-year rate plans – the primary driver of earnings stability – include special reconciliation provisions allowing recovery of uncollectible expenses (bad debts), late payment charges, and other cost components subject to diligent annual review but capped at about half a percent (0.5%) of total customer bills per commodity (electricity or gas). These caps limit how much Con Edison can charge customers annually for these costs; any amount exceeding caps currently becomes deferred regulatory assets intended for recovery in future base rate proceedings [S1][S13][S18].
This mechanism provides some cushion against volatility but also delays full cost recovery when bad debt levels surge beyond baseline assumptions.
Rising Aged Accounts Receivable Impact
The largest operational headwind comes from elevated aged accounts receivable balances owing to modifications made during the COVID-19 pandemic related to collection suspensions and service disconnections moratoria.
CECONY's aged receivables over 60 days ballooned reportedly from roughly $408 million pre-pandemic levels (Feb-2020) up to approximately $1.43 billion at end-2025 – an increase exceeding threefold over five years [S1][S13]. Similarly, O&R's aged receivables rose though on a smaller scale.
This deteriorated working capital profile diminishes liquidity flexibility forcing reliance on credit lines or short-term borrowings despite healthy operating cash flows generated cumulatively.
While the utilities have resumed standard collection activities post-pandemic, reasonable customer hardship considerations continue prolonging elevated receivables profiles imposing cash timing impacts.
Rate Plan Structures Through 2028
CECONY's current rate plans spanning January 2026 through December 2028 define explicit reconciliation thresholds above which variances between actual uncollectible expenses plus late payment charges vs approved levels are deferred:
- Above $10 million total net expense variance in calendar year 2026,
- Rising to above $15 million in 2027,
- And increasing further beyond $20 million threshold in year 2028.
The surcharge recovery annually remains capped generating only modest bill impacts (~0.5% total customer bill per commodity); any surplus amount above this cap must be deferred for potential future recoupment via subsequent base rate cases or surcharges [S18].
O&R follows similar but scaled-down reconciliation mechanisms with combined annual thresholds close to ~$0.9 million electric / ~$0.5 million gas relevant for its smaller service territory [S18].
Strategic Growth Prospects
Consolidated Edison's growth outlook hinges on several vectors:
- Execution of infrastructure modernization programs including grid hardening and integration of renewables facilitating higher capital expenditure capacities within allowed returns frameworks,
- Continued rate plan approvals permitting requisite cost pass-throughs,
- Expansion via Con Edison Transmission projects regulated federally under FERC which offers incremental long-duration revenue streams tied to high-voltage grid enhancements.
However, constraints around bill impact caps inherently limit ultimate near-term profit leverage from above-normal expense variability such as bad debts or unexpected operational costs.
Additionally, market participation by competitors is constrained by high entry barriers created through natural monopoly status complemented by deep urban network entrenchment.
Regulatory scrutiny also intensifies on affordability metrics given demographics served adding complexity to tariff design negotiations.
Financial Position and Capital Allocation
Liquidity is supported by a strong cash position of approximately $1.63 billion alongside current assets totaling nearly $6.75 billion at fiscal year-end December 31, 2025 compared to current liabilities just slightly lower at about $6.61 billion yielding a current ratio around parity (1.02x), highlighting narrow short-term coverage margins typical for utilities managing sizable working capital accounts including fuel inventories and receivables [F1].
To manage refinancing needs amid these conditions, CECONY recently entered into a new senior unsecured term loan facility aggregating $500 million with a one-year maturity that replaced part of maturing debt obligations showcasing proactive balance sheet stewardship amid evolving funding needs [S5][S8].
Operating cash flow surged markedly (+33% YoY) reaching nearly $4.8 billion primarily due to improved collections partially offset by continued investment outlays. Capital expenditures remain hefty near mid-$4+ billion range focused on renewables integration, system resilience upgrades, and transmission expansions. Because capex absorbs most operating cash generation capacity, free cash flow stays constrained near ~$335 million indicating limited structural excess cash available for discretionary purposes currently [F1].
Dividend policy stays steady with approximately $1.17 billion paid out during FY25 fulfilling shareholder return commitments while share repurchase activity halted since FY24 likely reflecting prudent allocation amid ongoing receivables uncertainty and regulatory constraints preventing aggressive capital distributions or leverage increases [F1][S21].
ROE approximates an industry-moderate ~8.4%, aligning with regulated utility norms balancing risk-weighted returns against mandate-driven investment requirements.
Sector Analysis Contextual Note
In highly regulated urban utilities like Consol Edison operating dense metro grids balancing multiple commodities (electricity/gas/steam), managing aged receivables post-pandemic is increasingly common across U.S peers amid inflationary pressures complicating bill affordability programs—a factor investors watch closely due to its influence on liquidity cycles although offset historically by structured regulatory reconciliation mechanisms unique to jurisdictions like New York. Furthermore, utilities of this scale typically exhibit capital intensity ratios whereby sustaining capex routinely equals or slightly exceeds operating cash flows given essential asset renewal schedules—an important consideration when analyzing free cash flow sustainability absent external financing interventions.
What To Watch Next (Analysis)
With no explicit forward guidance disclosed beyond existing rate plans covering through late-decade timeline [N1][N3], future performance monitoring should focus on:
- Trends in aging accounts receivable normalization versus continuing elevated balances,
- Regulatory commission decisions regarding surcharge limit relaxations or base rate case outcomes influencing timing of deferred cost recoveries,
- Progression of Con Edison Transmission projects ramping contribution under FERC supervision,
- Capital markets activity addressing longer-term debt refinancing needs premised on current liquidity tightness. These factors collectively represent critical inflection points determining whether Con Edison can restore more normalized liquidity profiles while maintaining sanctioned earnings growth trajectories amid persistent operational constraints.
This analysis is based solely on publicly available information from recent SEC filings ([S#]), news sources ([N#]), and historical company financials ([F1]). It does not constitute investment advice or recommendations.
Disclaimer: This is research-only, informational analysis and not investment advice. It may include AI-generated interpretation and general industry context. Always verify important details using primary sources.
Comments