
EMCOR Group Posts Record Revenue and Expands Through Strategic Acquisitions
EMCOR Group achieved milestone financial results in 2025, driven by broad demand growth and targeted acquisitions including Miller Electric.
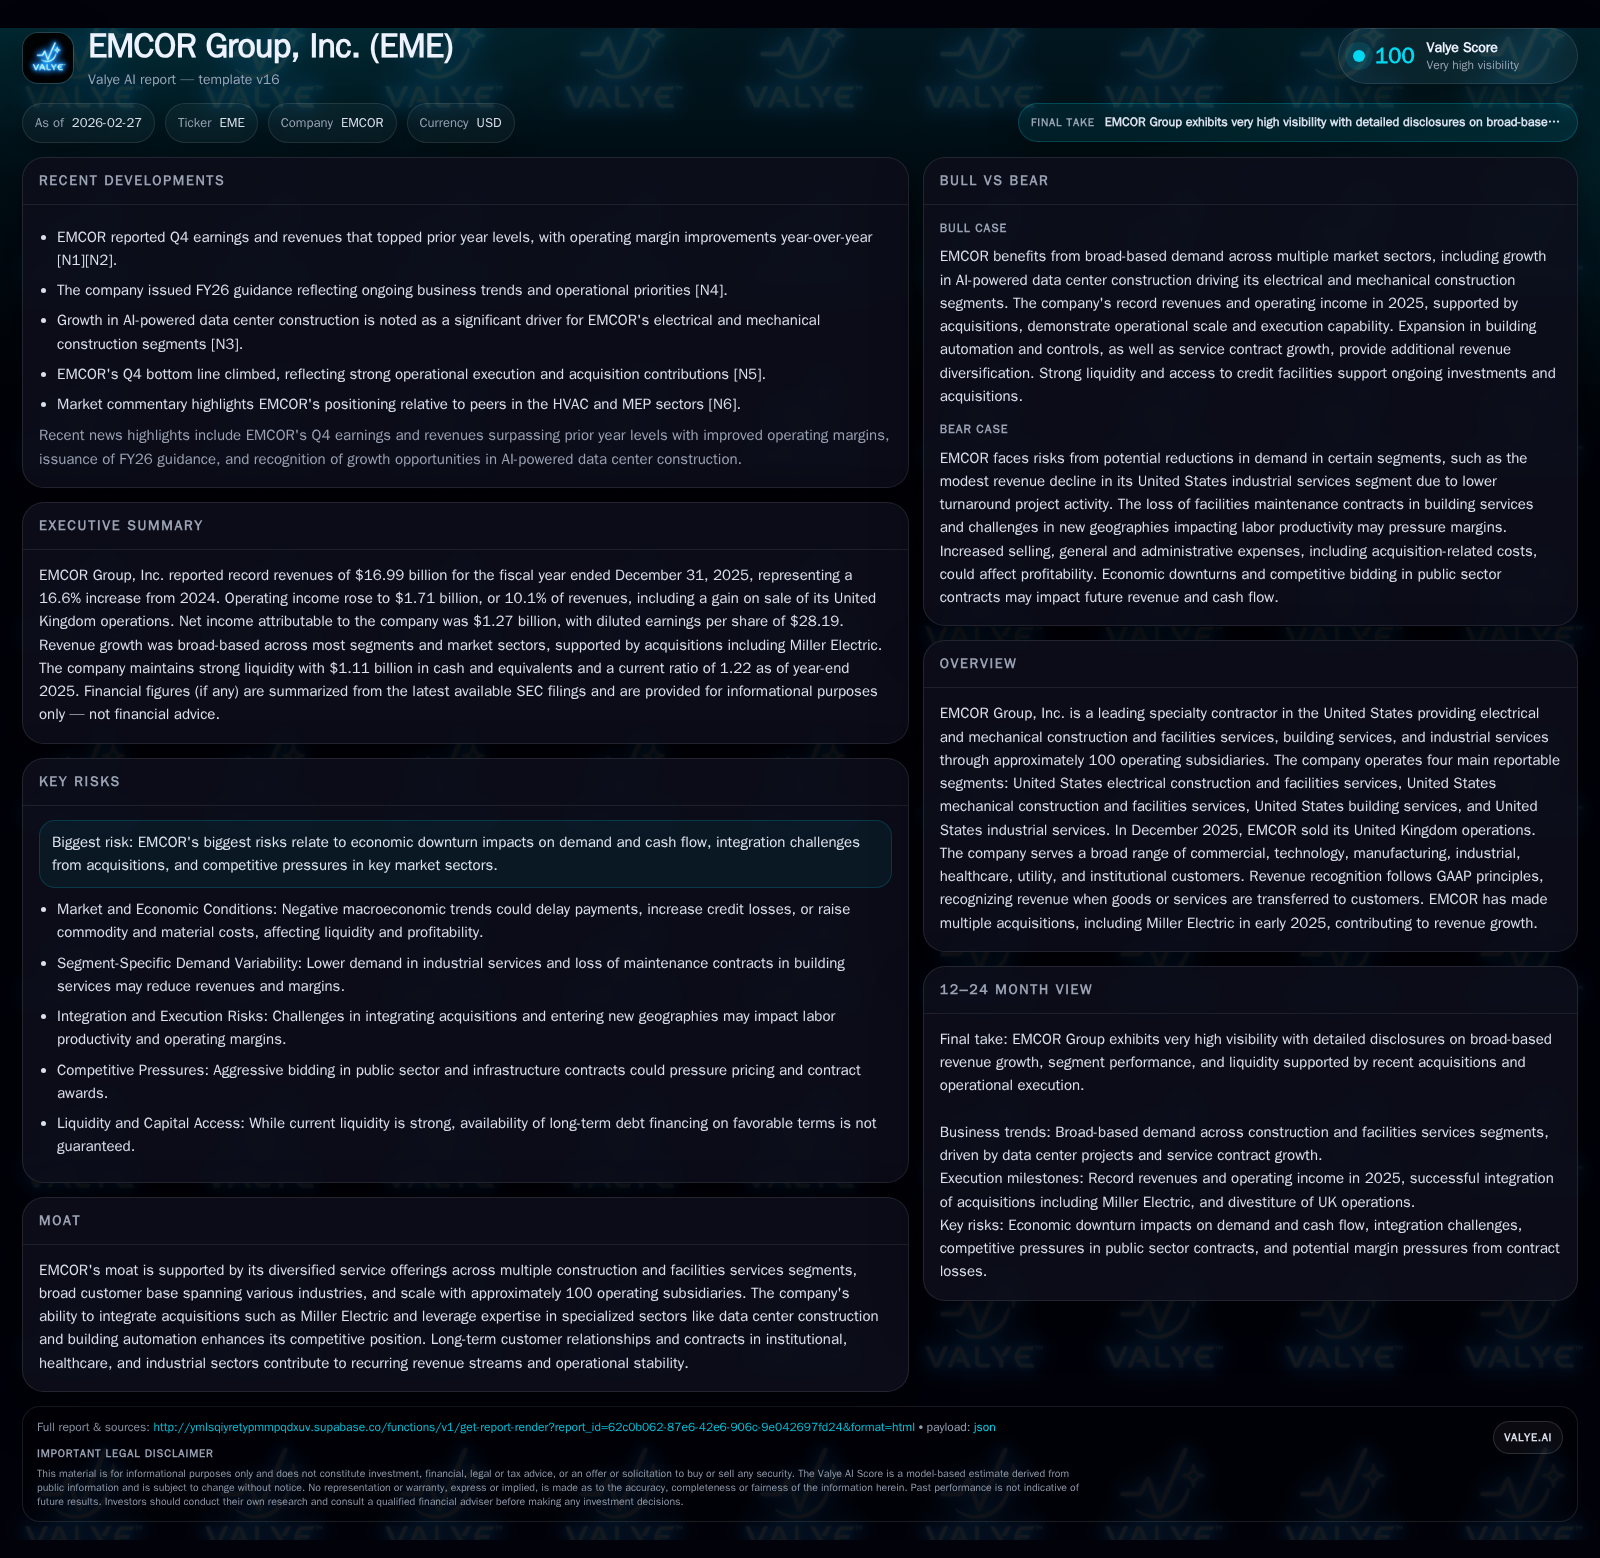
In fiscal year 2025, EMCOR Group reported record revenue of $17.0 billion, marking a 16.6% increase over the prior year, with operating income rising 27.4% to $1.71 billion. The company's growth was fueled by strength in electrical and mechanical construction segments, alongside acquisition contributions totaling approximately $1.27 billion in revenues. Capital allocation priorities balanced robust share repurchases and a significant dividend hike while maintaining solid liquidity with over $1.1 billion in cash and ample credit capacity. Future prospects hinge on leveraging multi-sector demand and navigating integration risks amid economic cyclicality.
EMCOR’s Milestone 2025: Revenue and Earnings Break Records
EMCOR Group closed fiscal year 2025 with revenues soaring to nearly $17 billion, representing a robust 16.6% year-over-year increase from $14.57 billion in 2024 [F1][S1]. Operating income surged even more sharply by 27.4% to approximately $1.71 billion from $1.34 billion the prior year, elevating operating margins to a record 10.1% [F1][S1]. Net income attributable to EMCOR rose by 26.4% to over $1.27 billion with diluted EPS climbing to $28.19 from $21.52 per share [F1][S1].
The company’s financials were further bolstered by a significant non-recurring gain of around $145 million arising from the December 2025 sale of its United Kingdom operations—a transaction that enhanced operating margin by roughly 85 basis points [S1]. Excluding this one-time gain, operating income increased by almost $224 million, underscoring underlying operational strength.
Historical performance (annual)
| FY | Rev ($bn) | Net ($mm) | CFO ($mm) | OpInc ($mm) | Rev YoY | Net YoY |
|---|---|---|---|---|---|---|
| 2025 | 17.0 | 1273 | 1302 | 1713 | +16.6% | +26.4% |
| 2024 | 14.6 | 1007 | 1408 | 1345 | +15.8% | +59.1% |
| 2023 | 12.6 | 633 | 900 | 876 | +13.6% | +55.9% |
| 2022 | 11.1 | 406 | 498 | 565 |
Source: SEC companyfacts cache [F1].
Capital returns and efficiency (annual)
| FY | Div ($mm) | Buybacks ($mm) | FCF ($mm) |
|---|---|---|---|
| 2025 | 45 | 586 | 1189 |
| 2024 | 43 | 490 | 1333 |
| 2023 | 33 | 128 | 821 |
| 2022 | 27 | 661 | 449 |
Source: SEC companyfacts cache [F1].
Table: EMCOR Group Historical Financial Performance FY2022-FY2025 (USD billions/millions)
Drivers Behind Growth: Segment Performance and Acquisition Impact
The surge in top-line was predominantly underpinned by strong performances in the U.S electrical construction and facilities services segment along with mechanical construction and facilities services [S18][S22]. Electrical construction revenues expanded substantially driven by booming network and communications projects—particularly data center electrification supporting the artificial intelligence infrastructure surge [S18][N8][N9]. Mechanical services also grew notably amid heightened activity in hospitality and water/wastewater sectors.
Conversely, industrial services experienced a modest decline attributable to fewer turnaround projects billed mostly post-completion per standard industry terms [S18][S4].
Incremental acquisition revenues accounted for roughly $1.27 billion of total sales in FY25, including early-year acquisition Miller Electric [S1]. While the acquisitions provided volume uplift and margin enhancement opportunities through specialized service capabilities—particularly integrated MEP (mechanical, electrical, plumbing) contracting for critical facilities sectors—they also introduced intangible asset amortization expenses ($50 million netted against acquisition contributions) which temper margin expansion slightly [S1].
Navigating Market Demands: Service Diversification and Customer Reach
EMCOR leverages a diversified service portfolio spanning specialty contracting, installation, comprehensive facilities services, and industrial maintenance across industries such as commercial real estate, technology/data centers, healthcare institutions, manufacturing plants, utilities, and universities [S22]. This breadth underpins resilience against cyclical shocks while enabling cross-selling opportunities.
A distinctive strength lies in long-term contracts especially within institutional and healthcare sectors providing recurring revenue streams that buffer volatility [N8]. For sectors like AI-powered data centers experiencing exponential electrification requirements for cooling and power distribution systems—electrical construction expertise combined with building automation drives significant value capture [N8][N9].
This multi-faceted scope reflects an advanced MEP contractor’s role—not merely installing equipment but managing integrated system workflows essential for modern critical infrastructure deployments.
Acquisition Integration: Challenges and Contributions from Miller Electric
While acquisitions like Miller Electric have materially added to revenue scale (+$145 million within mechanical segment alone) [S18], they carry integration complexities common in specialty contracting firms including harmonizing operational processes, workforce cultures, IT systems, and accounting for amortization of acquired intangibles impacting near-term earnings quality [S1].
Management’s disclosure contemplates these risks but indicates that synergy realization is underway contributing positively to margin improvement outside one-time costs [S1]. The scale benefits from ~100 operating subsidiaries enable EMCOR to leverage cross-selling within overlapping markets enhancing competitive positioning.
Capital Allocation: Balancing Buybacks, Dividends, and Cash Management
EMCOR has pursued an aggressive capital return strategy concurrent with growth investments:
- Stock repurchases totaled approximately $586 million during FY2025—up from $490 million in FY24—with a remaining authorization of about $680 million under the ongoing repurchase program [F1][S9][S12]
- Quarterly dividends were raised notably +60%, from $0.25 per share paid during most of FY25 to an intended $0.40 commencing January 2026—a clear move signaling confidence in sustained cash flows [F1][S9]
- Capital expenditures rose more than half to around $113 million focusing on capacity enhancements supporting expanding service footprints [F1]
Notably ROE approximates an elevated ~35%, reflective of strong profitability growth paired with efficient equity utilization amid share retirements [F1]. This capital allocation mix balances immediate shareholder return preferences while preserving capacity for strategic investments.
Liquidity and Debt Profile: Strength Amidst Economic Cyclicality
As of end-2025, EMCOR held healthy liquidity with $1.11 billion cash equivalents complemented by an undrawn revolving credit facility totaling $1.3 billion of which roughly $1.23 billion remained unused—demonstrating ample financial flexibility without net debt burden outside finance lease obligations [F1][S4][S5][S6].
The current ratio stood at a reasonable ~1.22 reflecting manageable working capital given contract billing cycles ranging from upfront invoicing on certain maintenance contracts to arrears billing typical for large industrial turnarounds [S4]. These dynamics influence operating cash flow timing:
- Operating cash flow declined by about 7.5%, from roughly $1.41 billion in FY24 to $1.30 billion largely due to working capital build linked to contract progressions where prior advance billings were being utilized eventually normalizing cash conversion velocity [F1][S16]
Risk exposures include macroeconomic pressures potentially slowing discretionary project awards or elongating receivables turnover especially in public sector or longer-duration contracts requiring careful management of liquidity fluctuations.
Future Outlook: Guidance, Market Opportunities, and Risks to Monitor
EMCOR issued fiscal year ’26 guidance reflecting expectations for ongoing revenue and earnings growth fueled by sustained demand across core construction segments plus additional acquisition integration benefits [N3]. Tailwinds are expected from escalating investments in AI-driven data center infrastructure needing complex MEP installations—a secular growth vector identified among leading construction stocks tied to AI adoption trends [N8][N9].
Challenges persist surrounding:
- Potential softening global or domestic economic conditions impacting capital expenditures especially for discretionary private-sector projects,
- Execution risks related to continued absorption of acquisitions,
- Competitive intensity particularly within utilities/institutional markets requiring innovation,
- Information technology system disruptions given growing reliance on sophisticated platforms noted among risk disclosures [S1].
Overall diversification across multiple end-markets affords risk mitigation but mandates ongoing operational agility.
Valuation Implications and Investor Considerations
From an investor lens, EMCOR offers an intriguing case balancing rapid top-line expansion through both organic market capture and bolt-on acquisitions alongside disciplined capital returns evidenced by meaningful buybacks combined with dividend growth initiatives [F1][N2][N13]. The company’s differentiated moat stems from its scale (~100 subsidiaries), multi-segment service offerings across electrical/mechanical/building/industrial domains, and entrenched customer relationships fostering recurring revenue streams .
Wall Street commentary highlights positive sentiment on improving margins supported by strategic synergy realization post-acquisitions alongside secular themes like data center electrification underpinning forward growth narratives [N11][N13]. Key milestones ahead include quarterly earnings beats serving as barometers on integration effectiveness plus margin resilience amid macro uncertainties.
Disclaimer: This report is prepared solely for informational purposes based on publicly available data as of February 27, 2026; it does not constitute investment advice or recommendations.
Disclaimer: This is research-only, informational analysis and not investment advice. It may include AI-generated interpretation and general industry context. Always verify important details using primary sources.
Comments