
Evergy Faces Tradeoffs Between Capital-Intensive Growth and Regulatory Dividend Constraints
Evergy’s regulated utility operations underpin steady revenues while environmental compliance and growing load demands drive substantial capital spending.
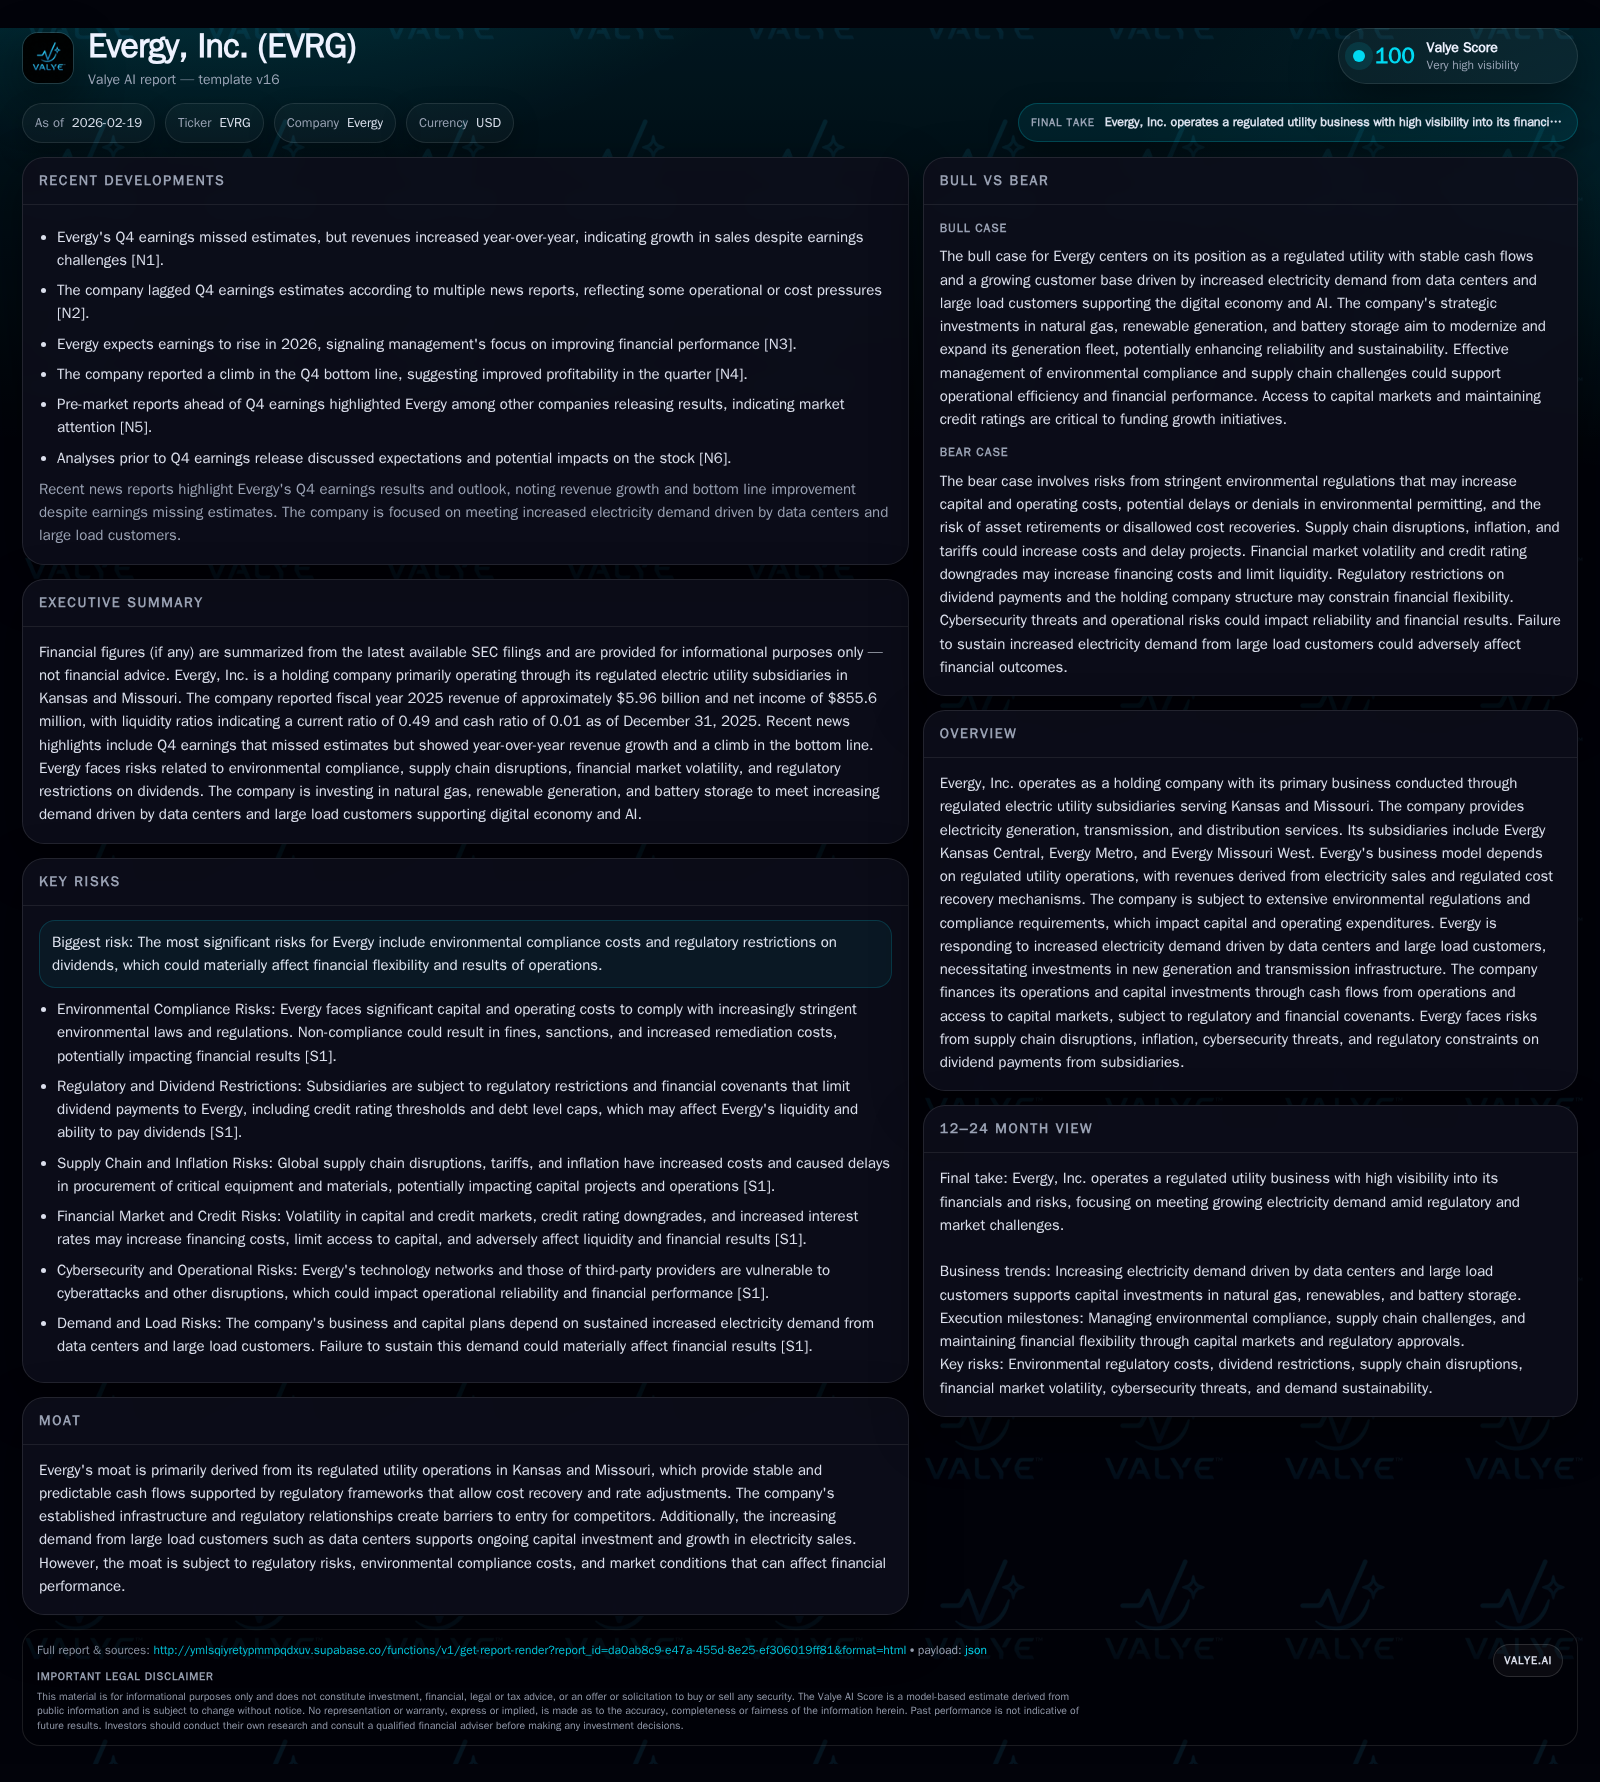
Evergy, Inc. operates regulated electric utilities in Kansas and Missouri, benefiting from stable cash flows secured by regulatory frameworks but challenged by rising capital expenditures tied to expanding load demands, especially from data centers. The company’s historical revenue growth averaged low single digits, with operating income growing moderately, yet net income showed modest decline recently. Significant investments in generation and transmission infrastructure are driven largely by heightened demand and sustainability goals but raise pressure on free cash flow and dividend policies constrained by regulatory limits. Monitoring cost recovery outcomes in rate cases and capital spending efficiency will be critical to assessing Evergy’s medium-term financial health.
Company Overview
Evergy, Inc. is a holding company principally engaged through its regulated electric utility subsidiaries serving Kansas and Missouri, including Evergy Kansas Central, Evergy Metro, and Evergy Missouri West . Its operations encompass generation, transmission, and distribution of electricity under regulatory regimes that allow cost recovery plus a return on invested capital. This structure provides a moat characterized by stable cash flows backed by state utility commissions’ oversight but introduces exposure to regulatory risk related to rate-setting processes and cost prudency determinations.
Historical Financial Performance
Over the past four fiscal years ending December 31, 2025, Evergy demonstrated consistent revenue growth with fluctuations attributable partly to underlying market demand variations (Table 1). Revenue ascended from $5.51 billion in FY2023 to $5.96 billion in FY2025 at a compound annual growth rate approaching 4%
Operating income exhibited positive momentum, rising from $1.28 billion (FY23) to $1.53 billion (FY25), representing operational efficiency gains amidst rising input costs such as fuel, labor, and materials heightened by inflationary pressures documented since mid-2024 [F1][S1]. Meanwhile, net income declined slightly by approximately 2% between FY24 ($873.5 million) and FY25 ($855.6 million), reflecting tightening margins potentially linked to unrecouped expenses or regulatory lag.
Capital expenditure notably accelerated alongside the company’s push to expand generation capacity and modernize transmission lines responding to customer load growth—especially data centers requiring highly reliable power infrastructures [F1][S7][S16]. Capital spending surged nearly 20% in FY25 compared with FY24, reaching $2.8 billion.
Historical performance (annual)
| FY | Rev ($bn) | Net ($mm) | CFO ($bn) | OpInc ($mm) | Rev YoY | Net YoY |
|---|---|---|---|---|---|---|
| 2025 | 6.0 | 856 | 2.0 | 1533 | +2.0% | -2.0% |
| 2024 | 5.8 | 874 | 2.0 | 1468 | +6.2% | +19.4% |
| 2023 | 5.5 | 731 | 2.0 | 1282 | -6.0% | -2.8% |
| 2022 | 5.9 | 753 | 1.8 | 1267 |
Note: Omitted columns lack sufficient annual XBRL coverage in the provided tags (need ≥2 annual points): Capex, Buybacks. Source: SEC companyfacts cache [F1].
Capital returns and efficiency (annual)
| FY | Div ($mm) | FCF ($mm) | ROE% |
|---|---|---|---|
| 2025 | 613 | -752 | 8.4 |
| 2024 | 597 | -353 | 8.8 |
| 2023 | 570 | -354 | 7.6 |
| 2022 | 535 | -365 | 7.9 |
Source: SEC companyfacts cache [F1].
Note: Buybacks omitted due to insufficient recent annual data post-2020.
Business Model Drivers
The company’s revenue base is anchored by regulated rate structures governed mainly by the Kansas Corporation Commission (KCC), Missouri Public Service Commission (MPSC), and Federal Energy Regulatory Commission (FERC). These regulators authorize tariffs subject to periodic review which reflect costs prudently incurred plus an authorized return on capital employed [S1].
Critical growth drivers include:
- Increasing electricity demand fueled by the surge of data centers hosting AI workloads within Evergy's service territory.
- Regulatory-approved capital recovery through plant-in-service accounting mechanisms known as PISA enacted recently allowing deferral of depreciation expense for qualifying investments; however capped at revenue impact thresholds limiting pace of recovery annually [S1].
- Environmental regulations mandating phased coal unit retirements and renewable energy integration require significant reinvestment into cleaner generation technologies driving CAPEX scale.
Conversely, earnings face headwinds from:
- Regulatory lag causing temporal mismatches between incurred costs and rate adjustments potentially compressing margins.
- Inflation-driven escalation of operational expenditures that may not be fully offset through tariffs before next rate cases.
- Uncertainties around maintaining favorable credit ratings which influence borrowing costs amid heavy debt-financing of capital plans [S9].
Regulatory Environment & Risks
Evergy assumes considerable regulatory risk stemming from its dependence on approval of rates sufficient for cost recovery plus reasonable returns which may be constrained by policy or legislative changes imposing moratoriums or modifying remuneration standards [S4][S6][S16].
Significant is the recent adoption of the plant-in-service accounting provisions permitting the creation of deferred regulatory assets representing unamortized depreciation plus associated allowed returns on qualifying plant additions:
- Kansas utilities capped at a maximum annual revenue requirement increase of ~1.5%,
- Missouri counterparts face slightly higher caps near ~2.5% per annum, thus potentially delaying full cost recovery if spending surges faster than these bands [S1].
Risks also include increasing environmental compliance expenditures due to stricter EPA rules on coal combustion residuals management as well as potential liabilities arising from asset retirements or contamination claims [S19][S22].
The regional wholesale market managed by Southwest Power Pool influences dispatch economics impacting wholesale sales volumes where non-dispatchable renewables intermittency also introduces variability into revenue streams [S26].
Capital Allocation & Financial Position
Evergy funds its extensive capital investment program primarily through internally generated cash flow supplemented by debt issuance given limited equity raises historically inherited from merger structures [F1][S11]. The operating cash flow has grown modestly but remains insufficient to cover CAPEX fully causing negative free cash flow approximately -$750 million in FY25.
Dividend payments have steadily risen aligned with underlying earnings growth but remain capped within regulatory dividend restrictions tied primarily to credit rating maintenance at BBB-/Baa3 consensus levels enforced by KCC/MPSC rulings excluding dividend distributions if credit metrics deteriorate below thresholds or leverage increases too much [S5][S11].
Notably, no share repurchases have been executed since before FY2020 reflecting management's prioritization of liquidity preservation during heavy infrastructure build-out phases.
ROE estimates based on trailing year figures hover near an estimated mid-single digit range (~8%) implying moderate profitability consistent with utility sector norms and reflecting regulatory returns rather than open market competitive dynamics.
Future Outlook & Catalysts
Company-issued guidance for FY26 indicates expectations for modest earnings growth fueled by sustained load increases primarily through data center contracts and continuous infrastructure enhancements supporting grid reliability amid evolving environmental mandates [N3].
Investors should monitor:
- Rate case outcomes notably whether FERC/KCC/MPSC approval pace aligns with capex deployment maintaining allowed returns,
- Load retention versus evolving energy consumption patterns amid distributed generation adoption,
- Inflation trends impacting O&M expenses,
- Credit rating trajectories influenced by leverage levels vs operating performance,
- Progression of environmental permitting impacting project timelines.
Failure of projected load expansions or protracted regulatory delays could impair earnings growth and liquidity profiles significantly.
Industry Context Analysis
The U.S regulated electric utilities sector is undergoing transformation driven by decarbonization policies increasing renewable power shares alongside traditional fossil fuel retirements requiring substantial grid modernization investment including smart grid technologies for higher operational resilience against cybersecurity threats—a material focus area given the sector’s critical infrastructure status . Rate design reforms increasingly grapple with recovering fixed grid costs while accommodating growing self-generation adoption via net metering, posing structural challenges to incumbent utility economics across many states.
Evergy's strategic focus on addressing AI-driven industrial load demand uniquely positions it within this dynamic though it must balance aggressive CAPEX against potentially constraining rate frameworks—a classic tension in regulated utilities facing rapid technology shifts.
Conclusion
Evergy exemplifies a regulated electric utility managing growth amid escalating capital requirements compelled by rising customer load driven largely by digital economy expansionaries such as data centers combined with tighter environmental regulations imposing cost burdens requiring careful navigation through complex state commission approvals under structured rate base remuneration models.
While historical performance shows stable revenue increases accompanied by expanding operating income, net profitability faces headwinds from inflationary pressures and evolving regulatory constraints particularly regarding dividend payouts governed intimately by credit rating covenants and state mandates.
Market participants will keenly observe Evergy's progress on executing capital projects efficiently balanced against these constraints alongside monitoring whether prudence in cost recovery sustains financial flexibility vital for continued infrastructure investments necessary for future load growth accommodation.
This analysis provides an informational overview based on publicly available filings and news without expressing investment opinions or recommendations.
Disclaimer: This is research-only, informational analysis and not investment advice. It may include AI-generated interpretation and general industry context. Always verify important details using primary sources.
Comments