
Fortune Brands Innovations' Revenue and Operating Income Retreat Calls for Strategic Review
A detailed analysis of Fortune Brands Innovations' recent financial setbacks alongside its capital discipline and market footprint.
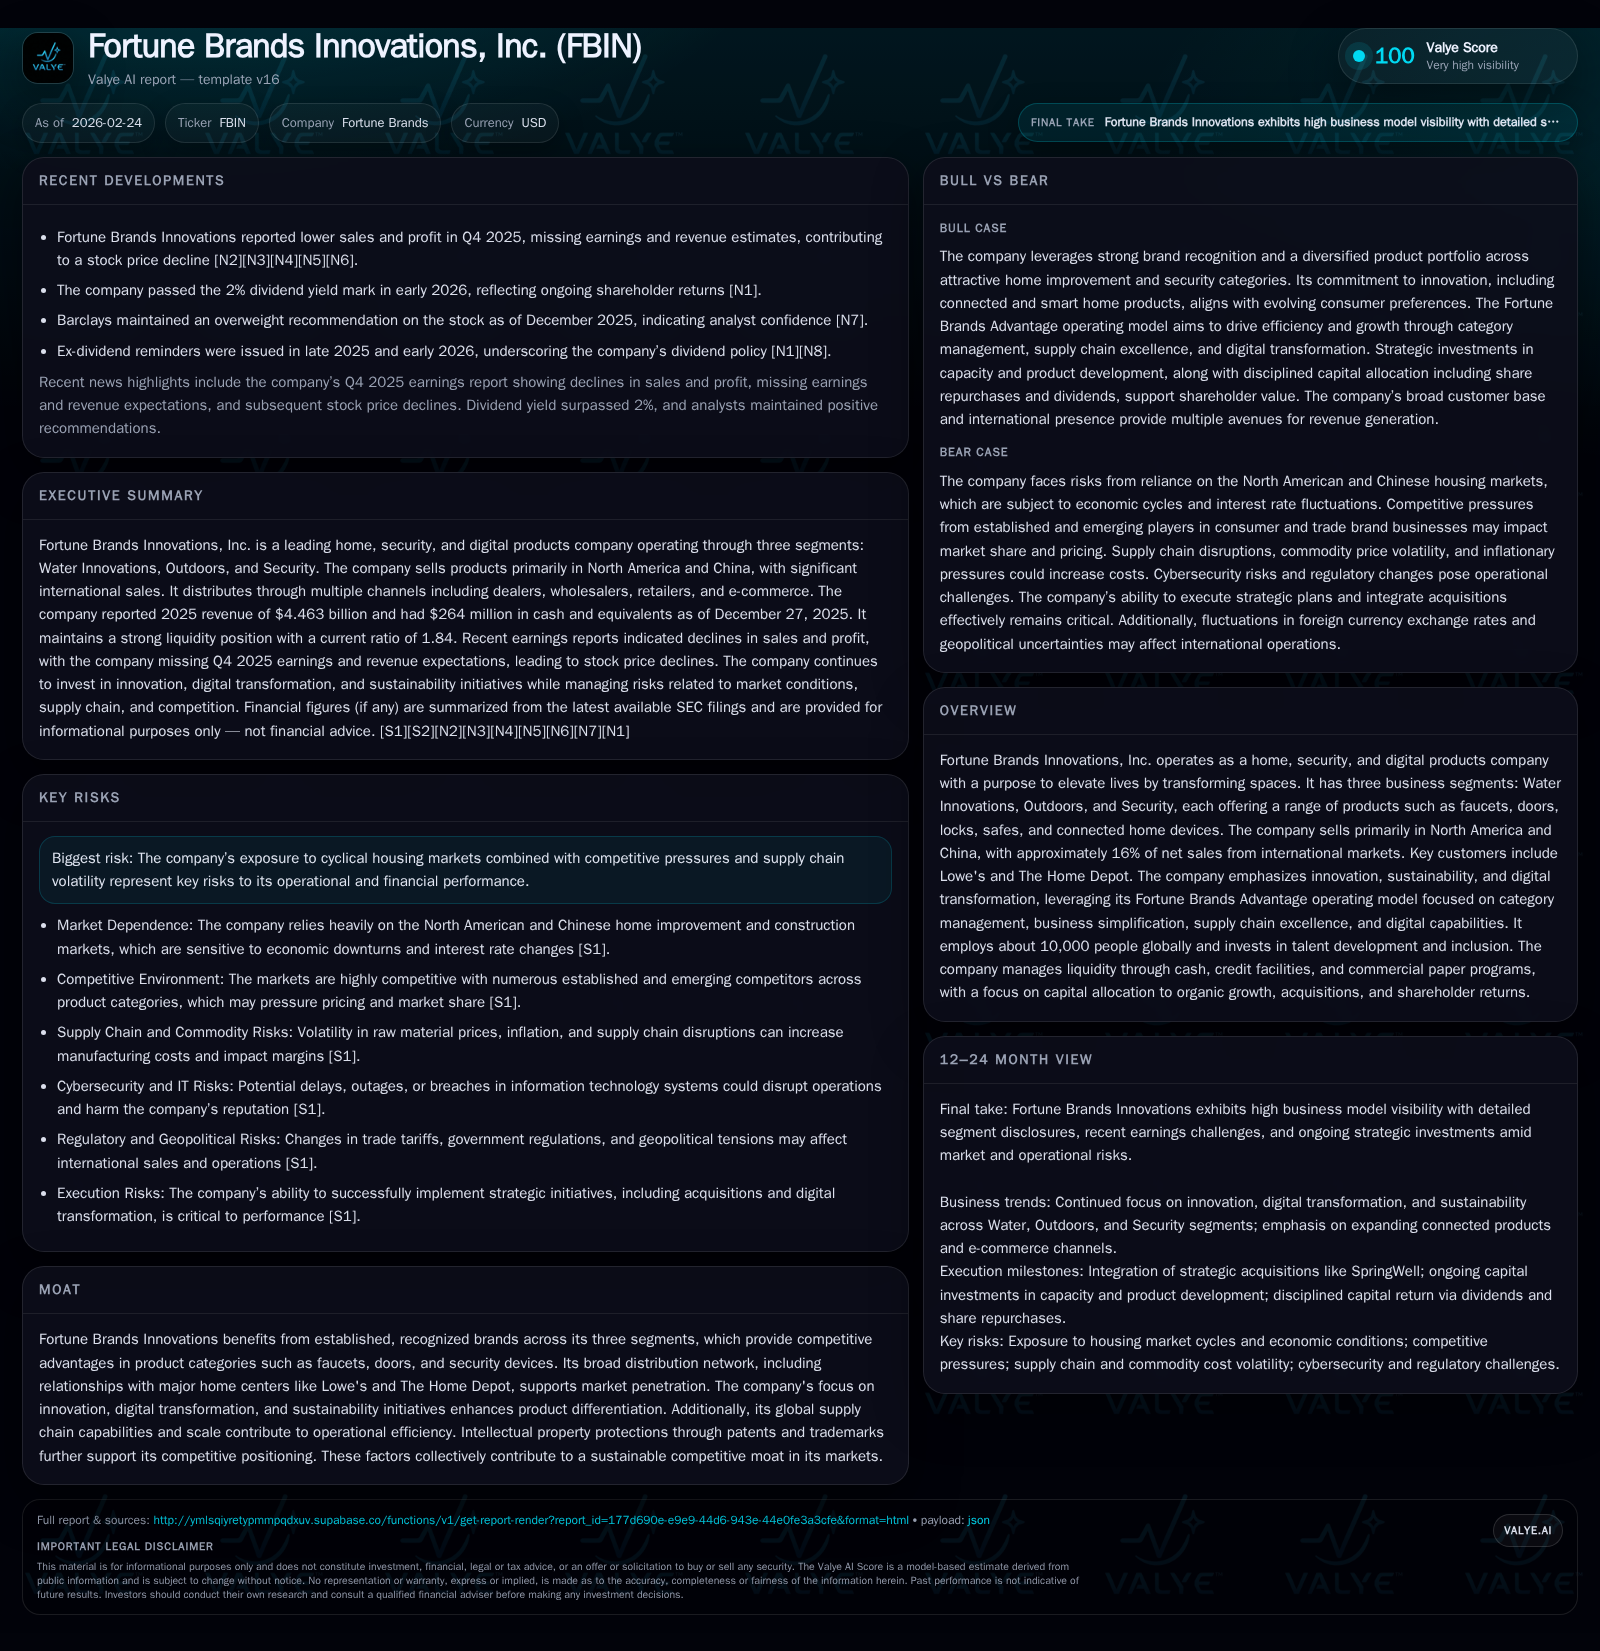
Fortune Brands Innovations, Inc. experienced a 3.2% revenue decline and a sharp 30.1% fall in operating income for fiscal year 2025, reflecting margin pressures amid cyclical housing sector headwinds. Despite these setbacks, the company has maintained robust capital allocation practices including consistent dividends and significant share buybacks, supported by a conservative liquidity profile and manageable long-term debt maturities. Its three segments—Water Innovations, Outdoors, and Security—continue to drive the product portfolio, with digital transformation and sustainability initiatives aimed at sustaining competitive differentiation. The company’s exposure to North American and Chinese housing markets introduces volatility risks, underscoring the importance of monitoring housing starts and remodeling trends going forward.
Examining Recent Revenue and Profit Trends
Fortune Brands Innovations reported FY2025 revenues of $4.46 billion, marking a 3.2% decline from the prior year's $4.61 billion [F1]. This contraction contrasts with relatively flat top-line growth over 2023-2024, indicating emerging headwinds likely associated with the broader housing market softening. More pronounced is the downturn in operating income, which dropped by a steep 30.1% year-over-year from $738 million in FY2024 to $516 million in FY2025 [F1]. Such a margin squeeze signals either rising input costs or decreasing pricing power within competitive trade channels.
Operating cash flow followed suit with a 28.3% decrease to $479 million for the year versus $668 million prior [F1], while capital expenditures fell markedly by over 42% to about $112 million [F1], underpinning a cautious investment stance amid uncertain growth prospects.
Historical performance (annual)
| FY | Rev ($bn) | CFO ($mm) | OpInc ($mm) | Capex ($mm) | Rev YoY |
|---|---|---|---|---|---|
| 2025 | 4.5 | 479 | 516 | 112 | -3.2% |
| 2024 | 4.6 | 668 | 738 | 193 | -0.4% |
| 2023 | 4.6 | 1056 | 615 | 257 | +308.7% |
| 2022 | 1.1 | 566 | 774 | 246 |
Note: Omitted columns lack sufficient annual XBRL coverage in the provided tags (need ≥2 annual points): Net, ROE%. Source: SEC companyfacts cache [F1].
Capital returns and efficiency (annual)
| FY | Div ($mm) | Buybacks ($mm) | FCF ($mm) |
|---|---|---|---|
| 2025 | 121 | 248 | 367 |
| 2024 | 120 | 240 | 475 |
| 2023 | 117 | 150 | 799 |
| 2022 | 146 | 580 | 320 |
Source: SEC companyfacts cache [F1].
*Net income data not available post-2022 per tags; latest net income is from FY2022 at $687 million [F1].
This financial performance mix captures the tension between maintaining brand strength and navigating margin pressures amidst a decelerating macroeconomic environment.
Segment Dynamics: Water Innovations, Outdoors, and Security
Fortune Brands operates across three core segments: Water Innovations, Outdoors, and Security [S12][S17]. The Water segment specializes in faucets and related fixtures employing brass, zinc, stainless steel, and resin materials [S26]. It accounts for the largest portion of sales but faces ongoing commodity price volatility that can compress margins—a common challenge for home improvement suppliers relying on metal inputs.
Outdoors encompasses entry doors, decking products, millwork components under well-known brands like Therma-Tru and Fiberon . This segment leverages extensive category management expertise at major home centers such as Lowe’s and The Home Depot where it derives approximately one-third of segment sales [S12][S20]. However, this channel dependency carries trade demand elasticity risks tied tightly to remodeling spend cycles.
The Security segment includes locks, safes, electronic access control devices marketed under Master Lock, Yale, August among others [S20]. Approximately one-fifth of its net sales originate internationally across Europe, Japan, Australia [S20], exposing it to geopolitical dynamics particularly given ongoing China trade complexities.
Across all segments, Fortune Brands emphasizes supply chain excellence supported by digital tools enhancing inventory management and responsiveness—crucial within today’s tight supply-side environment [S14]. Nonetheless, cyclical exposure intrinsic to each portfolio area manifests in uneven quarterly performances.
Market Dependencies and Impact of Housing Cycles
FBIN’s revenue streams are notably sensitive to North American housing cycle fluctuations alongside its growing footprint in China’s residential markets [N1][N2][S26]. The U.S.-based channels are heavily influenced by new construction activities which have faced headwinds recently due to elevated interest rates dampening buyer demand [N1][N2]. Remodeling expenditure elasticity further compounds revenue variability given its larger role in water innovations and outdoors sales.
In China, regulatory measures affecting property development alongside recent economic volatility create additional operational uncertainty [S26]. Trade customers’ discretionary buying behaviour is amplified during downturns—a point highlighted by FBIN management commentary referencing slower order patterns during Q4 FY2025 earnings disclosures [N2][N3][N4].
This cyclical interplay makes FBIN vulnerable to shifts in housing starts data and consumer sentiment metrics pivotal for projecting recovery timelines or further downside risk assessments.
Sustainability, Innovation, and Digital Transformation Efforts
Fortune Brands places strategic emphasis on product innovation coupled with sustainability initiatives as core elements under its "Fortune Brands Advantage" operating model aimed at category leadership [S14]. Investments into connected home device capabilities within the Security segment illustrate advancing digital integration into traditional hardware categories—a niche expected to foster differentiation amidst commoditized markets.
Digital capabilities also extend into supply chain management where end-to-end visibility seeks to mitigate raw material inflation impacts or logistics disruptions ahead of competitors [S14]. Sustainability efforts targeting reduced environmental footprints align with rising consumer preferences for eco-responsible home improvement products.
While such initiatives are conceptually sound moats supporting premium positioning long-term, measured results hinge significantly on execution agility amid volatile macroeconomic backdrops currently constraining capital spend priorities internally.
Capital Structure, Liquidity, and Debt Maturity Profile
FBIN’s balance sheet exhibits prudent leverage positioning with total debt amounting to approximately $2.54 billion as of fiscal year-end December 27, 2025 (inclusive of commercial paper liabilities) down from over $2.67 billion in prior year periods due primarily to senior note repayments ([S1],[S4],[S5],[S6],[S8]). Notably:
- The firm repaid all June 2015 senior notes ($500 million) at maturity mid-2025 utilizing cash reserves supplemented by commercial paper borrowings.
- Remaining long-term notes largely mature between September 2029 through March 2052 across staggered coupon profiles ranging from ~3.25% up to ~5.88% ([S1],[S2],[S8]).
- Revolving credit facilities totaling $1.25 billion were amended extending maturity till January 2031 with variable SOFR-based interest rates (~SOFR +0.80%-1.30%), acting as liquidity backstops for commercial paper issuance ([S4],[S5],[S6]).
- Covenants include maintaining EBITDA-to-interest expense ratios above minimum thresholds (3x), comfortably met as per latest filings ([S4],[S19]).
Cash equivalents stood near $264 million predominantly held offshore which presents tax repatriation considerations ([F1],[S4]) but overall signal adequate near-term liquidity buffers supported by strong recurring cash flow generation noted above.
Capital Allocation: Dividends, Share Repurchases, and Investment Priorities
The company sustained dividend payments around the $120 million annual mark throughout recent years reflecting consistent shareholder return policies ([F1],[S14],[S16]). Dividend continuity underscores high free cash flow reliability even amid slowing revenues.
Concurrently FBIN executed substantial share repurchase programs scaling buybacks up notably in FY2025 with nearly $248 million spent acquiring approximately four million shares reducing outstanding float ([F1],[S14]). This activity demonstrates disciplined capital allocation seeking EPS accretion while preserving flexibility given uncertain top-line dynamics.
Capex levels showed marked declines—from $256 million in FY2023 down to $112 million in FY2025—representing about ~2.5% revenue reinvestment presently ([F1]). Management guidance suggests incremental capacity investments around $110-$140 million planned for FY2026 focused on productivity improvements plus digital-enabled growth platforms ([S4]).
Free cash flow after deducting capex remains solid albeit diminished compared against peak years yet sufficient to cover dividends plus meaningful buybacks without debt covenant breaches ([F1]).
Outlook and What to Watch for in 2026
Management commentary around Q4 FY2025 results outlines cautious expectations for modest revenue stabilization contingent on recovering trade channel demand correlated with housing starts metrics across North America ([N2],[N5],[S3]). Margin expansion plans emphasize cost efficiencies augmented through digital supply chain initiatives combined with selective pricing actions intended to offset inflationary pressures.
Absent explicit multi-year guidance disclosures currently available publicly ([N5]), external observers should monitor developments around U.S./China housing data releases as leading indicators influencing volume recoveries or potential further contractions.
Investors would also benefit from tracking execution efficacy on innovation rollouts especially within smart lock technologies that signify strategic transformation bets beyond legacy hardware products.
Risks: Supply Chains, Competitive Pressures, and External Vulnerabilities
Primary operational risks reside within volatile raw material inputs including steel alloys used across security devices plus brass/zinc alloys predominant in plumbing fixtures ([S26],[S20]). Supply chain disruptions arising from global geopolitical frictions or transportation bottlenecks may impose cost escalations or delay product availability thereby compressing margins further.
Competitive intensity continues notably from both established specialty manufacturers like Kohler or Masco as well as private-label merchandisers leveraging scale advantages within large retail customer bases ([S20]). Maintaining differentiated product value propositions is essential but challenged under price-sensitive trade environments exhibiting diminished buyer power amidst cyclicality.
International exposures especially linked to China add layered geopolitical risk profiles impacting sourcing flexibility or demand patterns given regulatory uncertainties ([S26]). Currency fluctuations likewise remain relevant yet manageable through hedging frameworks documented by the company ([S14]).
This analysis synthesizes public filings dated through February 2026 alongside recent earnings disclosures without providing investment advice or price forecasts. All financial figures are presented per reported GAAP definitions extracted from SEC filings (cited accordingly). Company-specific growth projections should be interpreted considering underlying economic conditions influencing the home improvement sector broadly.
Disclaimer: This is research-only, informational analysis and not investment advice. It may include AI-generated interpretation and general industry context. Always verify important details using primary sources.
Comments