
FB Financial Expands Regional Footprint Amid Steady Capital and Credit Management
FB Financial reported solid Q2 2026 results reflecting stable net income, robust capital ratios, and ongoing dividend growth following its Southern States Bancshares merger.
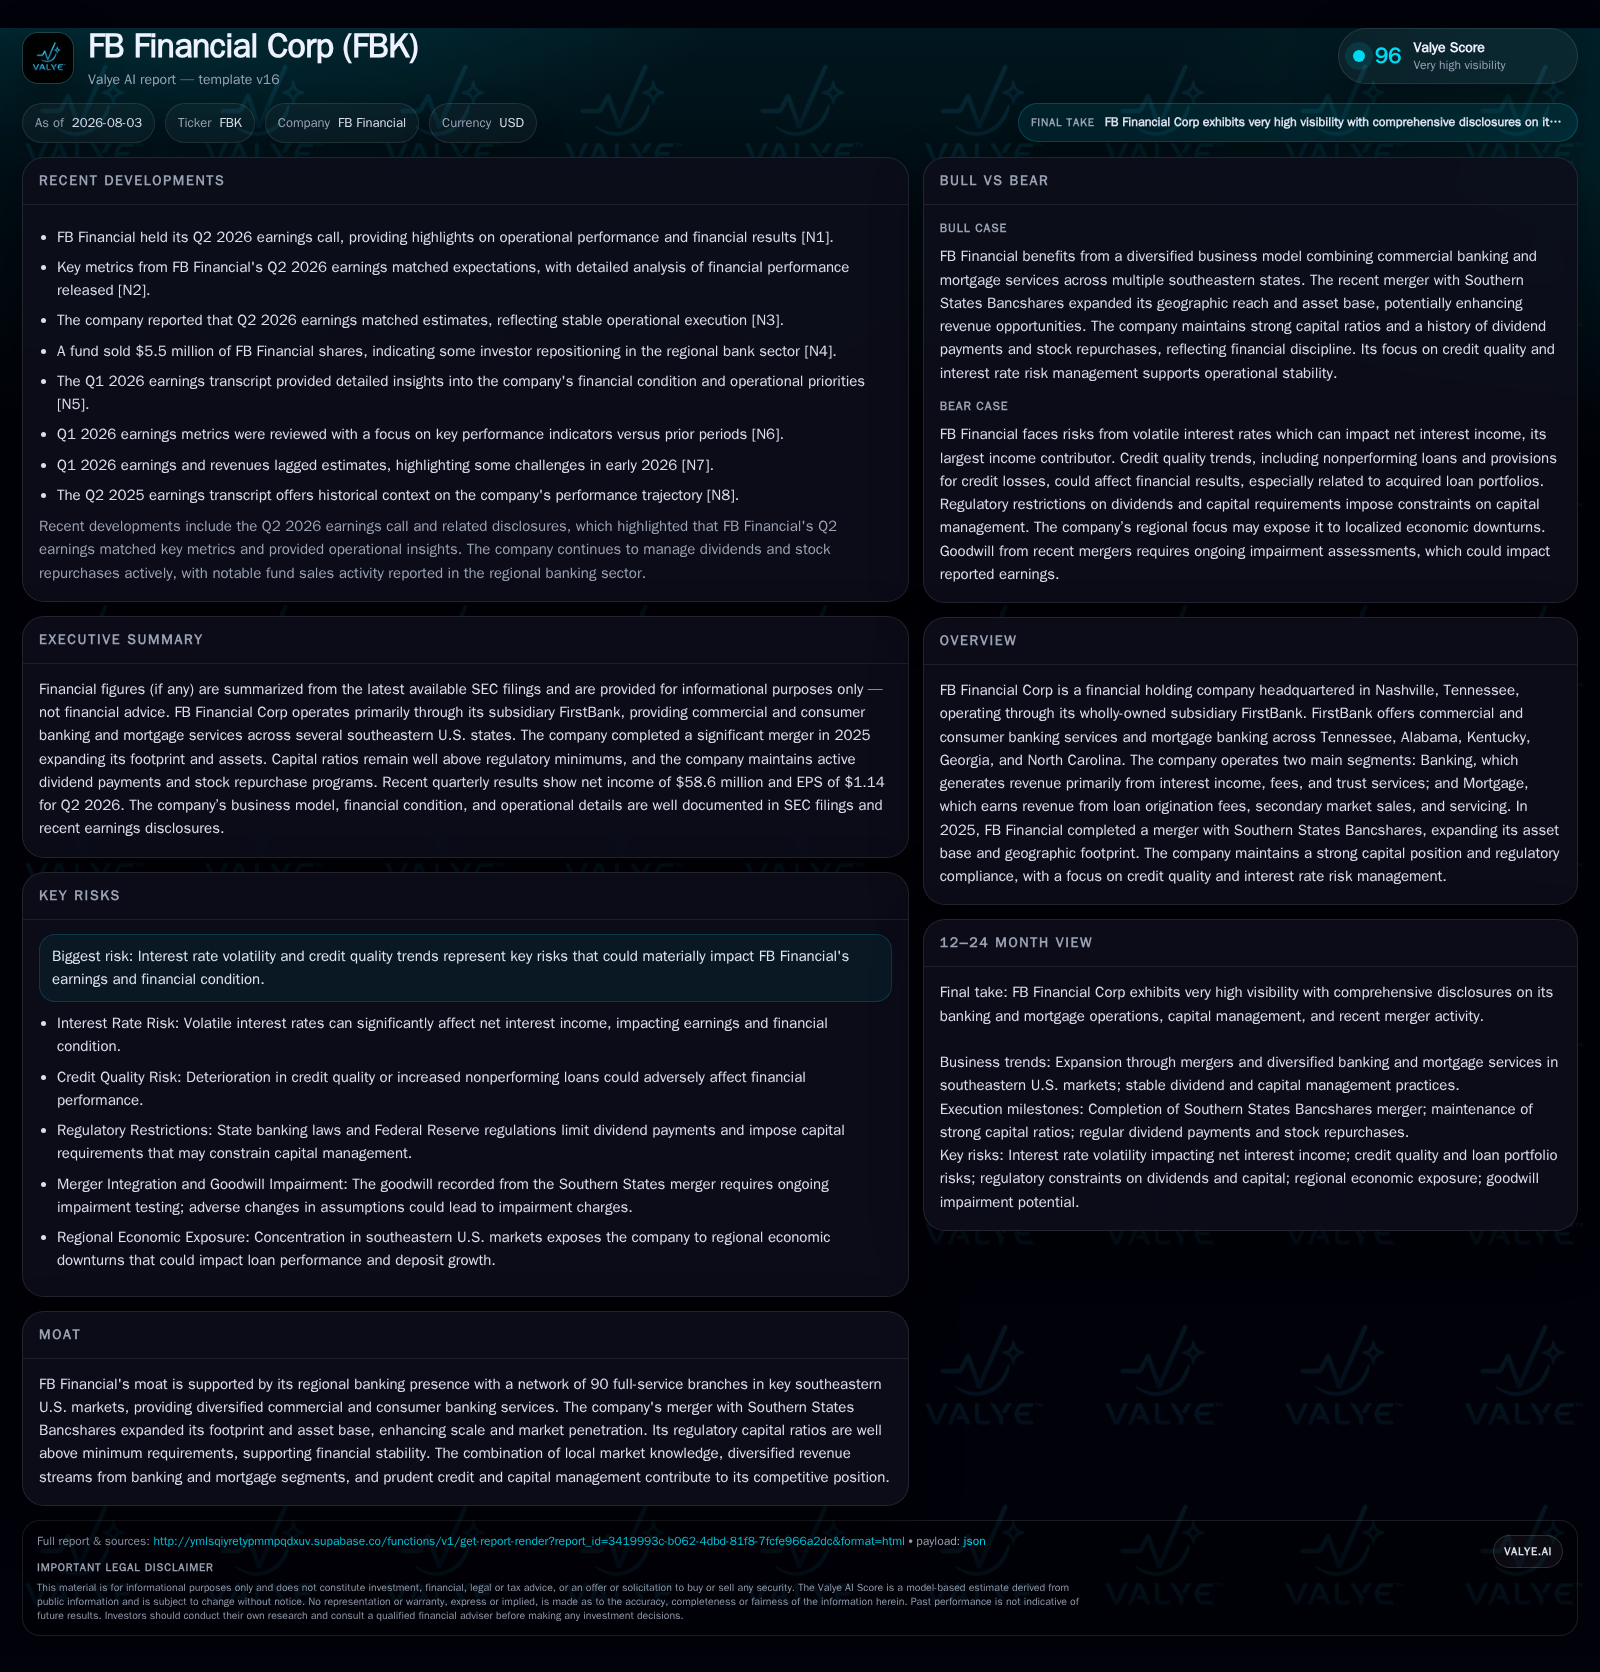
In Q2 2026, FB Financial Corp maintained strong earnings with net income bolstered by its dual banking and mortgage segments. The recent merger with Southern States Bancshares continues to enhance the company's scale and regional coverage across the southeastern U.S. Capital adequacy ratios remain comfortably above regulatory minima, underpinning prudent risk management. Key risks include interest rate volatility and credit quality trends; however, diversified revenue streams and disciplined capital deployment contribute to the company’s competitive positioning.
Recent Operating Update
FB Financial Corp’s latest quarterly filing (Q2 2026) shows sustained profitability with year-to-date net income of $116.2 million supporting shareholders’ equity at approximately $1.94 billion as of June 30, 2026 [S2][F1]. This result underscores ongoing strength in the company’s core operations during a moderately challenging macroeconomic backdrop. Dividend payments have also risen modestly; the company declared $0.42 per share through the first half of the year versus $0.38 in the prior-year period—signaling growing confidence in earnings stability and cash flow generation capacity [S2]. The Board further approved an additional dividend for Q3 2026 at $0.21 per share payable in late August [S2].
FY 2025 updates provided in the latest annual report reflect the transformative acquisition of Southern States Bancshares which significantly broadened FB Financial’s geographic footprint across five southeastern states: Tennessee, Alabama, Kentucky, Georgia, and North Carolina [S1]. This expanded branch network now includes approximately 90 full-service branches combining legacy FirstBank locations with those acquired through Southern States. This structural expansion enhances the ability to capture regional commercial banking relationships and diversify retail deposit sources—a critical advantage given typical funding cost pressures in regional banking.
Business Model Overview
FB Financial operates primarily through its subsidiary FirstBank offering two dominant business segments: Banking and Mortgage. The Banking segment generates revenue mainly through net interest income arising from commercial loans, consumer loans, and deposit-taking activities. Fee income is supplemented by trust services which provide recurring revenue streams via fiduciary management arrangements [S1]. Lending activity is primarily focused on small-to-medium businesses alongside consumer credit products tailored for regional client segments.
The Mortgage segment complements banking revenue by originating home loans deriving upfront fees from loan origination as well as capturing servicing income generated from maintaining mortgage portfolios or selling loans into secondary markets [S1]. This dual stream mitigates reliance on cyclical credit conditions impacting traditional lending margins.
Revenue mechanics depend heavily on managing net interest margin (NIM), which fluctuates with interest rate changes affecting both loan yields and funding costs (including deposit beta behavior). Deposit composition plays a significant role since low-cost core deposits support margin expansion relative to wholesale funding substitutes. Loan growth drives incremental interest income but requires vigilant credit risk oversight to control non-performing asset formation that could pressure provisions for loan losses.
Industry Structure and Competitive Positioning
Within regional banking, FB Financial fits into a cohort of midsize regional banks focusing on defined Southeastern U.S. markets alongside peers such as Regions Financial Corporation, Synovus Financial Corp., and Webster Financial Corporation. These banks compete on local knowledge, branch network density, tailored commercial banking solutions, and integrated mortgage offerings.
FBK’s competitive moat stems from its extensive branch network—about 90 locations—which remains a strategic advantage to maintain customer relationships critical for deposit gathering and cross-selling ancillary fee services like trust management [S1]. This face-to-face model offers resilience against fintech disruption particularly in primary banking product lines requiring local underwriting expertise.
Capital adequacy metrics bolster FB Financial’s standing versus peers by maintaining Tier 1 risk-based capital around 11-12% levels and leverage ratios over 10%, well above regulatory minimums defining "well-capitalized" status [S1][S2]. Such buffers enable compliant growth without excessive dilution or need for capital raising under stress scenarios.
Growth Drivers
Key growth vectors include:
- Branch Network Expansion: Leveraging the Southern States merger provides scalable infrastructure to deepen market penetration in fast-growing Southeast metro areas.
- Loan Portfolio Growth: Focused origination in commercial sectors combined with steady residential mortgage production fuels interest income expansion.
- Fee-Based Services: Trust services represent a meaningful recurring fee stream less sensitive to rate cycles contributing margin stability.
- Mortgage Segment Performance: Originations plus servicing rights sales into secondary mortgage markets provide fee diversification beyond traditional lending spreads.
- Capital Discipline: Strong equity cushions allow opportunistic mergers/acquisitions enhancing scale without compromising regulatory thresholds.
- Technology Deployment: Investments aimed at improving digital customer experience could reduce operating costs long-term impacting efficiency ratios favorably.
- Regional Economic Tailwinds: Southeastern U.S. economic growth supports credit demand for both consumer and commercial borrowers.
Risks and Watchpoints
Despite stable results, FB Financial faces several watchpoints:
- Interest Rate Sensitivity: Fluctuations in benchmark rates can compress net interest margin by increasing cost of funds faster than loan repricing due to deposit beta dynamics.
- Credit Quality Trends: Macroeconomic shocks could elevate delinquency rates leading to higher provision expense; though current indications show manageable non-performing asset ratios [S2].
- Regulatory Compliance Risks: Capital adequacy rules enforced by multiple agencies require ongoing compliance; violations could trigger restrictions or penalties [S1][S2].
- Competitive Pressures: Larger national banks with broader product suites or fintech disruptors targeting retail segments present ongoing challenges especially for deposit acquisition cost management.
- Deposit Mix Volatility: Shifts away from stable core deposits towards wholesale or brokered deposits can increase funding costs negatively impacting margins.
- Integration Risks: Post-merger systems consolidation or cultural integration failures could impair operational efficiency or lead to client attrition.
- Changing Consumer Behavior: Reduced foot traffic to branches might erode cross-sale opportunities if digital adoption lags compared to competitors.
What to Watch Next
Key indicators for upcoming periods include:
- Quarterly dividend declarations confirming dividend policy stability reflecting cash flow health post-merger.
- Loan growth rates providing evidence for portfolio expansion without credit dilution.
- Non-performing assets ratio moving directionally indicating underlying credit environment dynamics.
- Capital ratio trajectories maintaining well-capitalized status despite share repurchases or acquisitions.
- Mortgage origination volume since this segment materially affects non-interest income mix.
- Funding cost composition shifts revealing pressure points on net interest margin sustainability.
Market participants should also track management commentary during investor conferences such as the KBW Summer Bank Conference where strategic updates often surface shortly after quarter-end reports [S3].
Financial Profile Discussion
As of June 30, 2026, FB Financial held $1.11 billion in cash and equivalents against roughly $213 million total debt recorded at end of calendar year 2025 — suggesting a net cash position conducive to financial flexibility [F1]. Total shareholders’ equity stood at $1.94 billion midyear down slightly from $1.95 billion December-end primarily due to stock repurchases totaling $106 million alongside dividend payments absorbing about $22 million during H1 2026 [S2]. Book value per share rose modestly to $38.75 reflecting profitable operations despite return of capital initiatives.
Regulatory capital ratios remain strong with Tier 1 leverage exceeding 10%, total risk-based capital north of 13%, substantiating compliance with "well-capitalized" definitions by federal regulators [S1][S2]. Given bank dividends are constrained within state law limits tied closely to recent earnings plus retained income over prior years plus capital tests limiting distributions prevents excessive depletion of capital buffers while enabling attractive payouts consistent with peer norms.
Overall, FB Financial maintains a conservative financial profile balancing organic growth with disciplined capital returns including dividends and share buybacks — supporting shareholder value amid competitive regional banking dynamics.
Disclaimer: This analysis is for informational purposes only and does not constitute investment advice.
Disclaimer: This is research-only, informational analysis and not investment advice. It may include AI-generated interpretation and general industry context. Always verify important details using primary sources.

Comments