
Fidelity D & D Bancorp's Growth and Capital Strategy Under Macroeconomic Pressures
A detailed look at Fidelity D & D Bancorp’s financial trajectory, risk exposures, and capital management amid evolving market conditions.
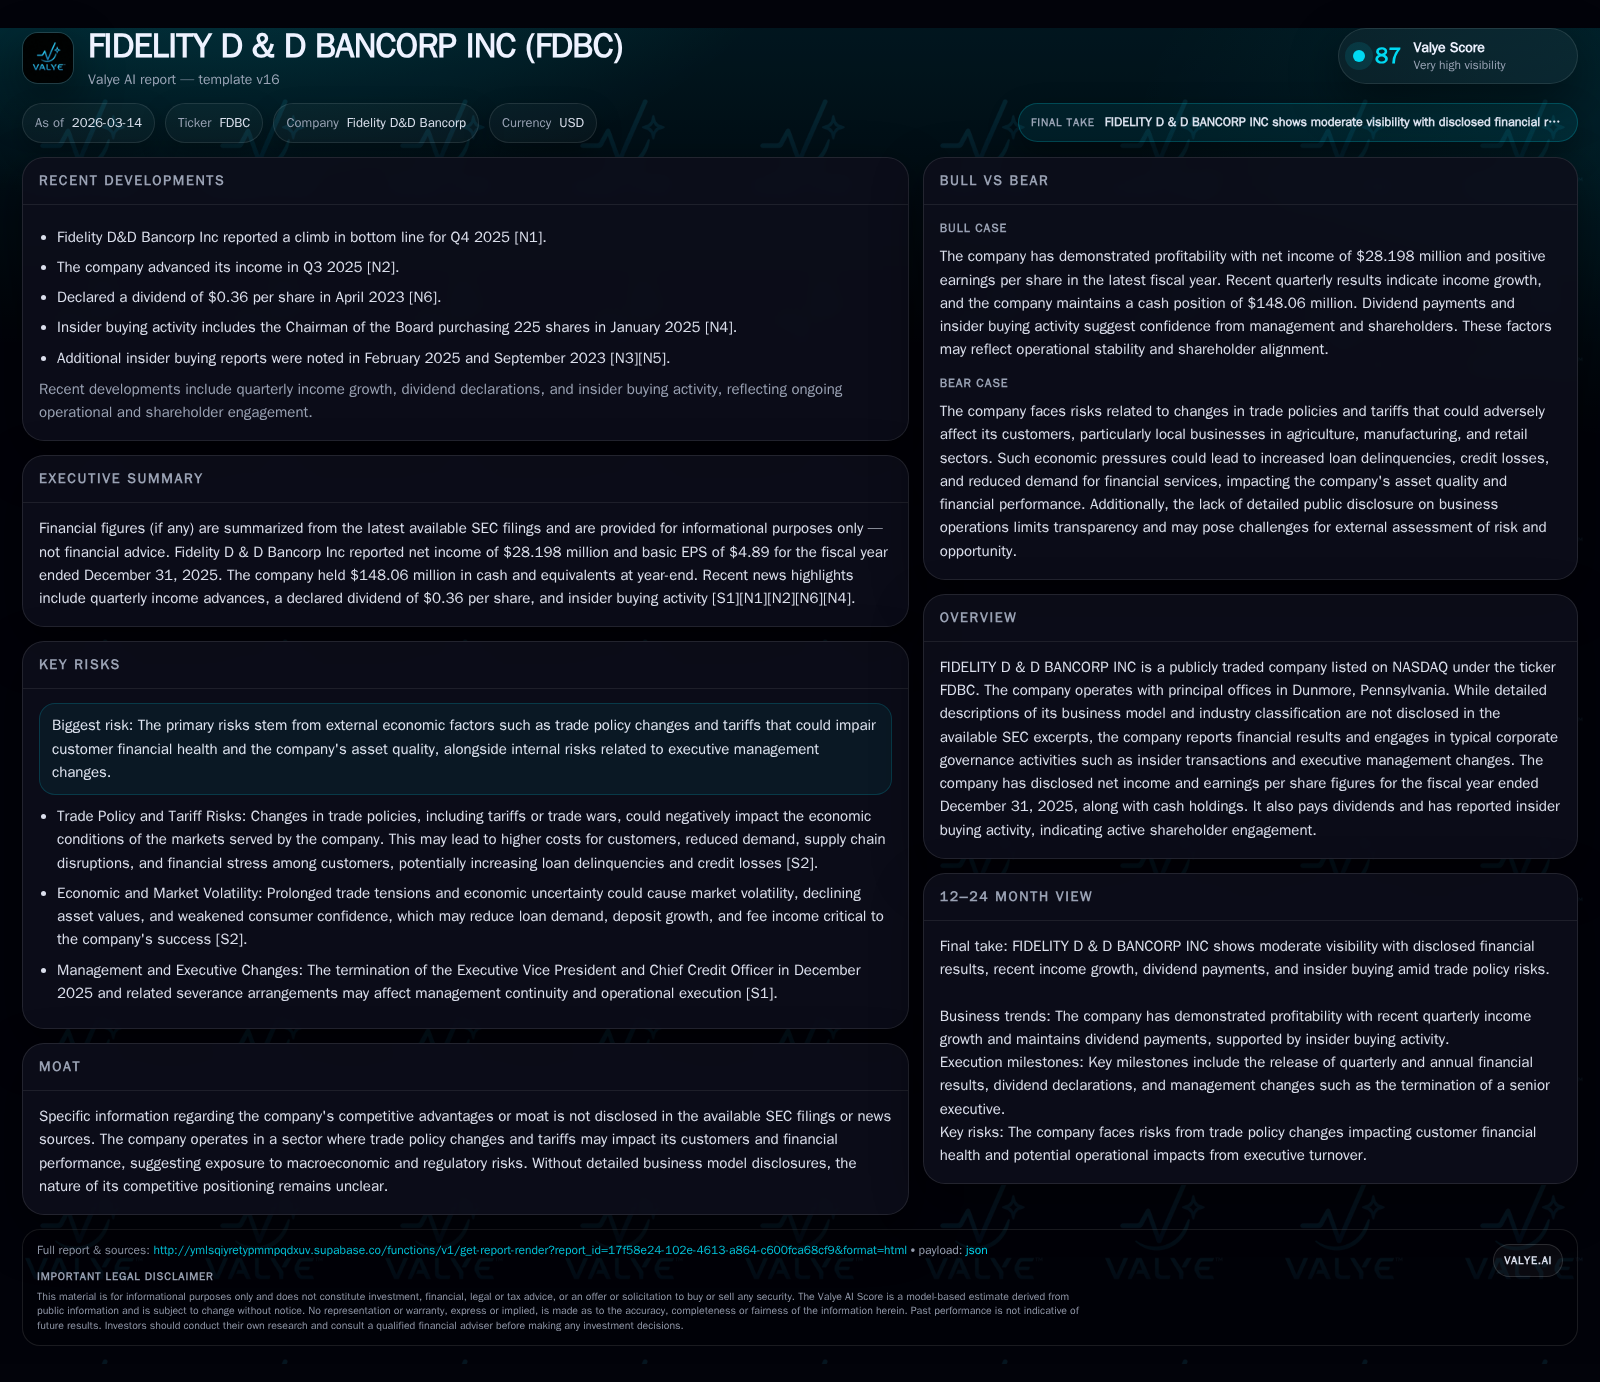
Fidelity D & D Bancorp Inc. (NASDAQ: FDBC) demonstrated solid net income growth in FY2025, driven by operational efficiencies and effective capital deployment despite macroeconomic headwinds tied to trade policy risks. The company expanded its executive leadership to bolster credit and lending strategies amid evolving economic uncertainties. Capital allocation showed consistency in dividends with a notable capex increase signaling strategic investments. Future growth hinges on mitigating external risks, managing asset quality, and leveraging market opportunities in its regional footprint.
Company Overview
Fidelity D & D Bancorp Inc. is a publicly traded bank holding company based in Dunmore, Pennsylvania, operating through its wholly-owned subsidiary, The Fidelity Deposit and Discount Bank [S1]. While specific industry classification details are sparse in SEC filings, available information suggests the company functions primarily as a regional bank servicing local businesses and consumer clients.
Historical Financial Performance
In fiscal year 2025, Fidelity D & D Bancorp reported a net income of approximately $28.2 million, marking a significant increase of 35.6% over the prior year’s $20.8 million [F1]. This uptick followed modest growth trends over preceding years — notably a rise from $18.2 million in 2023 to $20.8 million in 2024 — although FY2022 saw an anomalous net income peak near $30 million.
Operating cash flow (CFO) similarly improved sharply in FY2025 to $42.4 million (+43.3% YoY), suggesting enhanced core earnings quality or improved working capital dynamics [F1]. However, capital expenditures (capex) surged substantially by approximately 276% from $4.7 million to $17.5 million within the same period [F1]. This jump indicates intensified investment activity which may include branch expansions or technological upgrades critical for maintaining competitive relevance.
Equity climbed steadily to $238.9 million by end-2025 from $204 million the previous year [F1], producing an estimated return on equity (ROE) of around 11.8%. Dividend distributions were maintained at healthy levels ($9.4 million in FY2025), reflecting ongoing shareholder returns despite expansionary capex patterns [F1]. Buybacks tapered off post-2022; no significant repurchase activity was recorded beyond FY2022’s minimal figure.
Historical performance (annual)
| FY | Net ($mm) | CFO ($mm) | Capex ($mm) | Net YoY |
|---|---|---|---|---|
| 2025 | 28 | 42 | 18 | +35.6% |
| 2024 | 21 | 30 | 5 | +14.2% |
| 2023 | 18 | 30 | 7 | -39.3% |
| 2022 | 30 | 49 | 6 |
Source: SEC companyfacts cache [F1].
Capital returns and efficiency (annual)
| FY | Div ($mm) | Buybacks ($) | FCF ($mm) |
|---|---|---|---|
| 2025 | 9 | 25 | |
| 2024 | 9 | 25 | |
| 2023 | 7 | 0 | 23 |
| 2022 | 8 | 1263000 | 44 |
Source: SEC companyfacts cache [F1].
The table summarizes key annual financial metrics illustrating profitability trends, cash flow strength, investment scale-up, capital base expansion, and dividends.
External Environment and Risks
Management highlights trade policy changes—including tariffs—as a significant risk factor due to the company's customer base concentration in agriculture, manufacturing, and retail sectors [S2][S6]. Tariffs can raise input costs for these clients, reduce export opportunities, disrupt supply chains, induce layoffs, and increase credit stress leading to higher delinquency rates among loans held by the bank.
Moreover, prolonged geopolitical uncertainty or escalating trade tensions could impact market valuations and consumer confidence locally [S2]. Such external shocks would potentially squeeze loan demand and deposit inflows while curbing fee income sources vital to sustaining earnings momentum.
Internal risks include notable shifts within senior management roles recently disclosed [S20][S21][S22], such as termination of the Chief Credit Officer combined with appointments of new executives for lending and risk functions—reflecting strategic strengthening toward credit quality oversight amid uncertain macro dynamics.
Growth Prospects and Strategic Initiatives
While Fidelity D & D Bancorp does not provide explicit growth guidance or segment disclosures in filings reviewed [S1], there are signs of targeted leadership additions aimed at expanding lending capabilities and improving risk management frameworks [S22]. The hiring of a new Executive Vice President-Chief Lending Officer and a Chief Risk Officer denotes an active approach to both top-line loan origination growth and bottom-line asset quality maintenance.
Continued capital expenditure acceleration suggests investments aimed at operational modernization or geographic reach extension—typical drivers enabling longer-term fee income diversification beyond traditional interest spreads.
On the downside, macroeconomic headwinds tied to tariffs constitute a ceiling on near-term volume expansion due to their direct influence on key borrowing segments’ financial well-being [S2]. As such, future growth remains contingent upon navigating this volatility while leveraging internal governance enhancements.
Capital Allocation and Cash Flow Analysis
Free cash flow (FCF), approximated as operating cash flow minus capex for FY2025 at about $24.8 million [$42.36m - $17.54m = $24.82m; F1], remains robust despite substantial reinvestment into business capabilities.
Dividend payouts have increased modestly aligning with improving earnings capacity [$9.4m FY25 vs.$8.85m FY24; F1], indicating balanced shareholder return policy without compromising liquidity flexibility.
Absence of share repurchases since FY2023 suggests management prioritizes reinvestment over stock buybacks currently—a prudent stance given external uncertainties typical within regional banking during shifting trade regimes.
Liquidity appears well-managed through periodic SEC disclosures detailing debt structures but specifics are limited in reviewed filings .
What to Watch Forward (Analysis)
Key milestones worthy of monitoring revolve around:
- Continued earnings trajectory amid potential trade-related economic disruptions impacting loan performance.
- Executive team effectiveness especially new lending/risk officers’ contribution toward portfolio diversification and credit loss mitigation.
- Deployment outcomes from elevated capex spend particularly regarding digital banking initiatives or branch network enhancements.
- Dividend sustainability as a barometer of ongoing cash flow health versus reinvestment demands.
- Any shifts in share repurchase policies that could signal changing capital return priorities.
- Legislative or regulatory developments influencing trade policy dynamics affecting customer ecosystems.
Conclusion
Fidelity D & D Bancorp has exhibited measured profit growth supported by strategic investments and sound capital management approaching mid-2020s challenges tied primarily to macroeconomic uncertainty surrounding trade policies impacting its customer segments deeply rooted in local economies reliant on agriculture and manufacturing supply chains.
The company’s proactive leadership restructuring signals readiness to adapt underwriting standards and expand lending prudently while maintaining risk discipline—critical actions ensuring resilience given sector vulnerability to tariff fluctuations.
Maintaining dividend consistency alongside increasing capex investment paints a picture of cautious optimism focusing on long-term structural enhancements without compromising shareholder returns or liquidity buffers.
With incremental business model clarity lacking but observed through filings is a credible narrative of stable regional banking anchored by vigilant governance amidst geopolitical crosscurrents that demand continuous recalibration of strategic priorities.
This report is based exclusively on publicly available information from SEC filings dated through March 13, 2026, press releases as cited, and compiled financial data snapshots without speculative projections or investment recommendations.
Disclaimer: This is research-only, informational analysis and not investment advice. It may include AI-generated interpretation and general industry context. Always verify important details using primary sources.
Comments