
Free Flow USA’s Shifted Business Model and Financial Evolution
Tracing Free Flow USA's strategic pivots from green energy to scrap metal and beyond, highlighting their financial implications.
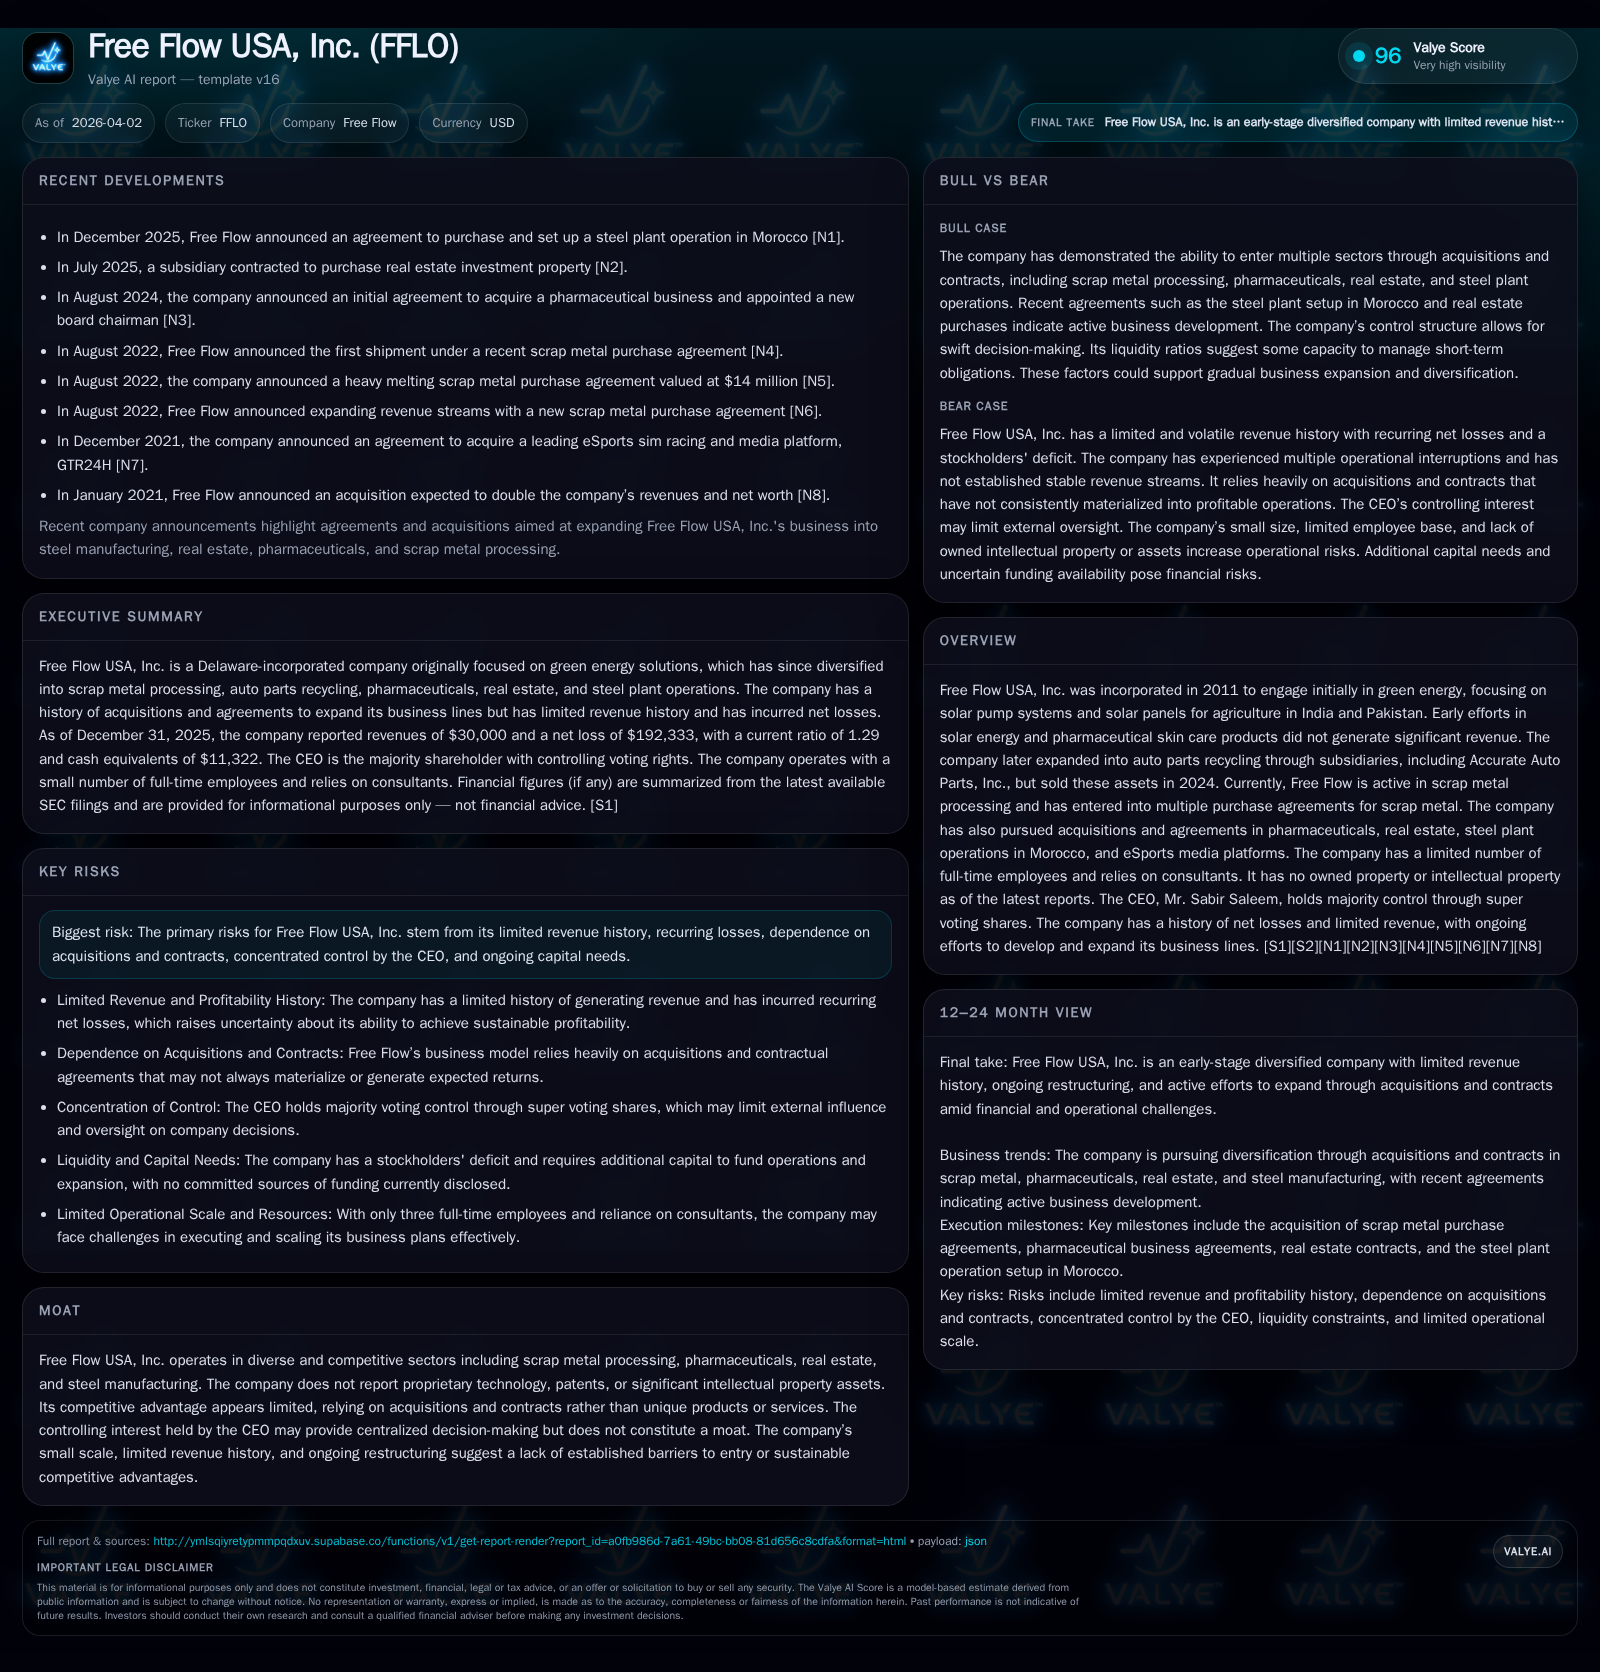
Free Flow USA, Inc. has undergone multiple operational transformations since its 2011 inception, shifting focus from solar energy products in South Asia to auto parts recycling and currently to scrap metal processing and diversified acquisitions. Despite a significant revenue increase in 2025, top-line scale remains modest with ongoing operating losses and negative cash flows, reflecting persistent profitability challenges. The company has restructured its capital by extinguishing secured debts through asset sales and issuing equity and promissory notes to address liquidity needs, but remains dependent on external funding for growth. Concentrated control by the CEO and a limited operational footprint compound risks associated with the firm’s early-development status and volatile business model.
From Green Energy Origins to Diversified Portfolio: Tracing Operational Shifts
Free Flow USA, Inc., incorporated in 2011 as Free Flow, Inc., initially pursued ventures within the green energy sector targeting agricultural applications. Its earliest projects centered on solar pump systems designed for use with water wells in India and Pakistan — markets driven by demand for alternatives to traditional electricity sources. However, declining solar panel prices undermined sustainability of this business line early on [S1][F1]. The company further experimented with pharmaceutical skin care products through subsidiaries such as Promedaff, Inc., investing $2 million in inventory and e-commerce buildout. These efforts failed to generate meaningful revenue and were ultimately unwound.
The company's transition continued into auto parts recycling beginning in 2016 under subsidiaries like Accurate Auto Parts, Inc., acquiring considerable physical assets in Virginia including large-scale facilities. Despite forming additional related entities (City Autos Corp., FFLO Auto Auction), operations were disrupted by landlord bankruptcies forcing asset sales culminating in divestiture of these holdings by March 2024 [S1][S13]. Post-sale, Free Flow reverted focus toward scrap metal processing via subcontracting arrangements alongside exploratory acquisitions across pharmaceuticals, steel manufacturing (Morocco), real estate, and eSports media platforms — though none have substantially contributed financially to date [S15][S25].
Notably, the company does not report owning proprietary technology or intellectual property assets; competitive positioning relies primarily on contractual arrangements and acquisition attempts without clear moat indications. This history underscores a pattern of opportunistic pivoting rather than development of core competencies.
Financial Trajectory: Revenue Growth and Operating Challenges Over Recent Years
Financially, Free Flow USA’s trajectory since 2022 paints a picture of volatility with intermittent revenue improvements overshadowed by consistent operating losses. The firm recorded revenues of $195k in FY2022 followed by steep declines to $9k (2024), with a rebound to $30k in FY2025 representing a substantial year-over-year revenue gain of approximately 228% [F1]. Despite this sharp increase, absolute top-line scale remains minimal for any substantive margin absorption.
Operating income improved nominally from losses exceeding -$342k (2022) down to about -$101k (2025) yet still reflects enduring unprofitability exacerbated by fixed costs and limited operating leverage [F1]. Net income results showed widening deficits again post-2024 peak gains linked to asset sales ($644k net income reported principally due to one-time transactions) collapsing back into a net loss of nearly -$192k for FY2025 [F1][S8].
Cash flow metrics echo these challenges: operating cash flow outflows remain notable at roughly -$203k (FY2025), although improved relative to previous periods [F1]. Reduced operational expenses—dropping from approximately $429k (nine months ended September 30, 2024) down below $98k for the comparable period ending September 30, 2025—stem primarily from lower professional fees and financial charges rather than scalable business growth [S8]. Capital expenditures are negligible or not material [F1]. Taken together, the financial profile signals an enterprise still burdened by overheads disproportionate to its revenue base.
Capital Structure Realignment and Liquidity Position
Following the sale of operational assets in early 2024, Free Flow extinguished all long-term secured debts linked to those holdings [S1]. The company’s balance sheet reflects ongoing restructuring with key moves including conversion of Series B & C preferred shares into promissory notes totaling approximately $1.19 million as of late September 2025 [S5]. These notes represent liabilities whose repayment timing remains subject to negotiation.
Current assets at end-2025 stood at around $207k with cash balances low ($11k), while current liabilities approximated $160k yielding a current ratio near 1.29 — indicative of just sufficient short-term liquidity buffers without cushion for expansion capital demands [F1][S8]. Subscription receivables related to share issuances ($200k) feature prominently as working capital inputs but remain contingent upon collection.
Absent committed financing lines or institutional backing, Free Flow relies heavily on private placements evidenced by multiple restricted common stock issuances between mid-2024 and mid-2025 totaling several hundred thousand dollars collected largely through investor subscriptions yet some still pending clearance [S5]. The fair value assessments for long-term liabilities reference ASC Topic 820 standards highlighting level 2 valuation inputs consistent with sector norms for unlisted securities subjectively priced based on borrowing rates [S3][S6].
Assessing Future Growth Prospects and Strategic Constraints
Growth catalysts are uncertain as per latest disclosures. Management continues efforts to pursue acquisitions—signing memorandums of understanding—but none have cleared due diligence hurdles sufficiently to finalize transactions [S1][S17]. This reflects both internal limitations (financial capacity) and external market vetting challenges.
Significant constraints stem from the company’s shallow revenue footprint coupled with an early stage operational profile despite over a decade since incorporation. Expansion is dependent on raising external capital under conditions that may entail onerous terms given risk perceptions [S17]. Governance concentration also presents material risk: CEO Sabir Saleem holds super voting rights through preferred shares enabling unilateral control over strategic direction which may complicate stakeholder alignment or minority interest protections.
Capital Allocation, Equity Moves, and Shareholder Returns Snapshot
Historically Free Flow has financed operations predominantly via equity issuances—including common stock sales at nominal prices—and convertible preferred stock offerings structured with varying redemption features [S5][S12][F1]. These moves have led to dilution yet remain necessary given absence of stable cash flow generation.
No dividends have been declared nor share repurchases conducted; payout policies appear nonoperative given continuous losses [S17]. ROE estimates must be interpreted cautiously: despite net losses reported in absolute terms (e.g., -$192k net loss FY2025), accounting peculiarities from negative shareholders’ equity yield an approximate positive ROE figure (~16.7%), primarily reflecting the inversion effect rather than profitable performance [F1].
Free cash flow remains negative aligned closely with operating cash outflows due to minimal capex requirements.
Strategic Risks Rooted in Operational Volatility and Concentrated Control
Intrinsic risks noted include:
- Persistent revenue volatility tied partly to macroeconomic factors including political uncertainty impacting buyers abroad,
- Repeated failed acquisition attempts increasing execution risk,
- Marginal operational scale raising vulnerability to fixed cost pressure,
- Liquidity constraints risking inability to fund growth or even ongoing expenses,
- Market risks associated with penny stock status such as illiquidity and wide bid-ask spreads,
- Potential governance conflicts emanating from CEO's concentrated ownership structure limiting corporate checks-and-balances [S1][S17].
These considerations frame Free Flow USA as an enterprise navigating structural headwinds without established durable advantages or stable market positions.
Key Metrics Table: Historical Performance Overview
Historical performance (annual)
| FY | Rev ($) | Net ($mm) | CFO ($) | OpInc ($) | Rev YoY | Net YoY |
|---|---|---|---|---|---|---|
| 2025 | 30000 | 0 | -202882 | -101834 | +227.9% | -129.9% |
| 2024 | 9148 | 1 | -427902 | -553720 | +126.9% | +377.5% |
| 2023 | 4032 | 0 | -22829 | -266451 | -97.9% | +91.6% |
| 2022 | 195137 | -3 | -304909 | -342362 |
Source: SEC companyfacts cache [F1].
Capital returns and efficiency (annual)
| FY | ROE% |
|---|---|
| 2025 | 16.7 |
| 2024 | -55.5 |
| 2023 | 11.5 |
| 2022 |
Source: SEC companyfacts cache [F1].
Note: Capex figures are not available beyond historical low amounts; YoY percentages calculated only when prior year data present.
What to Watch: Milestones and Catalysts Ahead
Given absence of explicit forward guidance or milestones disclosed by management thus far outside general acquisition pursuit statements [N/A], key indicators for monitoring Free Flow USA’s trajectory include:
- Successful execution and announcement of acquisition deals adding operable business lines,
- Sustained upward trend in revenue beyond nominal increments towards meaningful scale,
- Closure or formalization of purchase agreements underpinning scrap metal processing activity,
- Timely capital raises or securing debt facilities providing runway for growth initiatives,
- Operational staffing expansion signaling capability buildout beyond consultant-reliant model,
- Governance developments exposing minority investor protections or potential changes given CEO’s super-voting dominance.
Absent progress on these fronts the company remains exposed to continuation risks highlighted extensively throughout its filings.
Disclaimer: This report is intended solely for informational purposes reflecting publicly filed data up to April 2nd, 2026; it does not constitute investment advice nor an endorsement.
Disclaimer: This is research-only, informational analysis and not investment advice. It may include AI-generated interpretation and general industry context. Always verify important details using primary sources.
Comments