
Flywire Balances Revenue Growth With Emerging Profitability and AI-Driven Product Focus
FLYW posted strong revenue growth in 2025 alongside early signs of profitability amid a strategic shift emphasizing AI and software innovation.
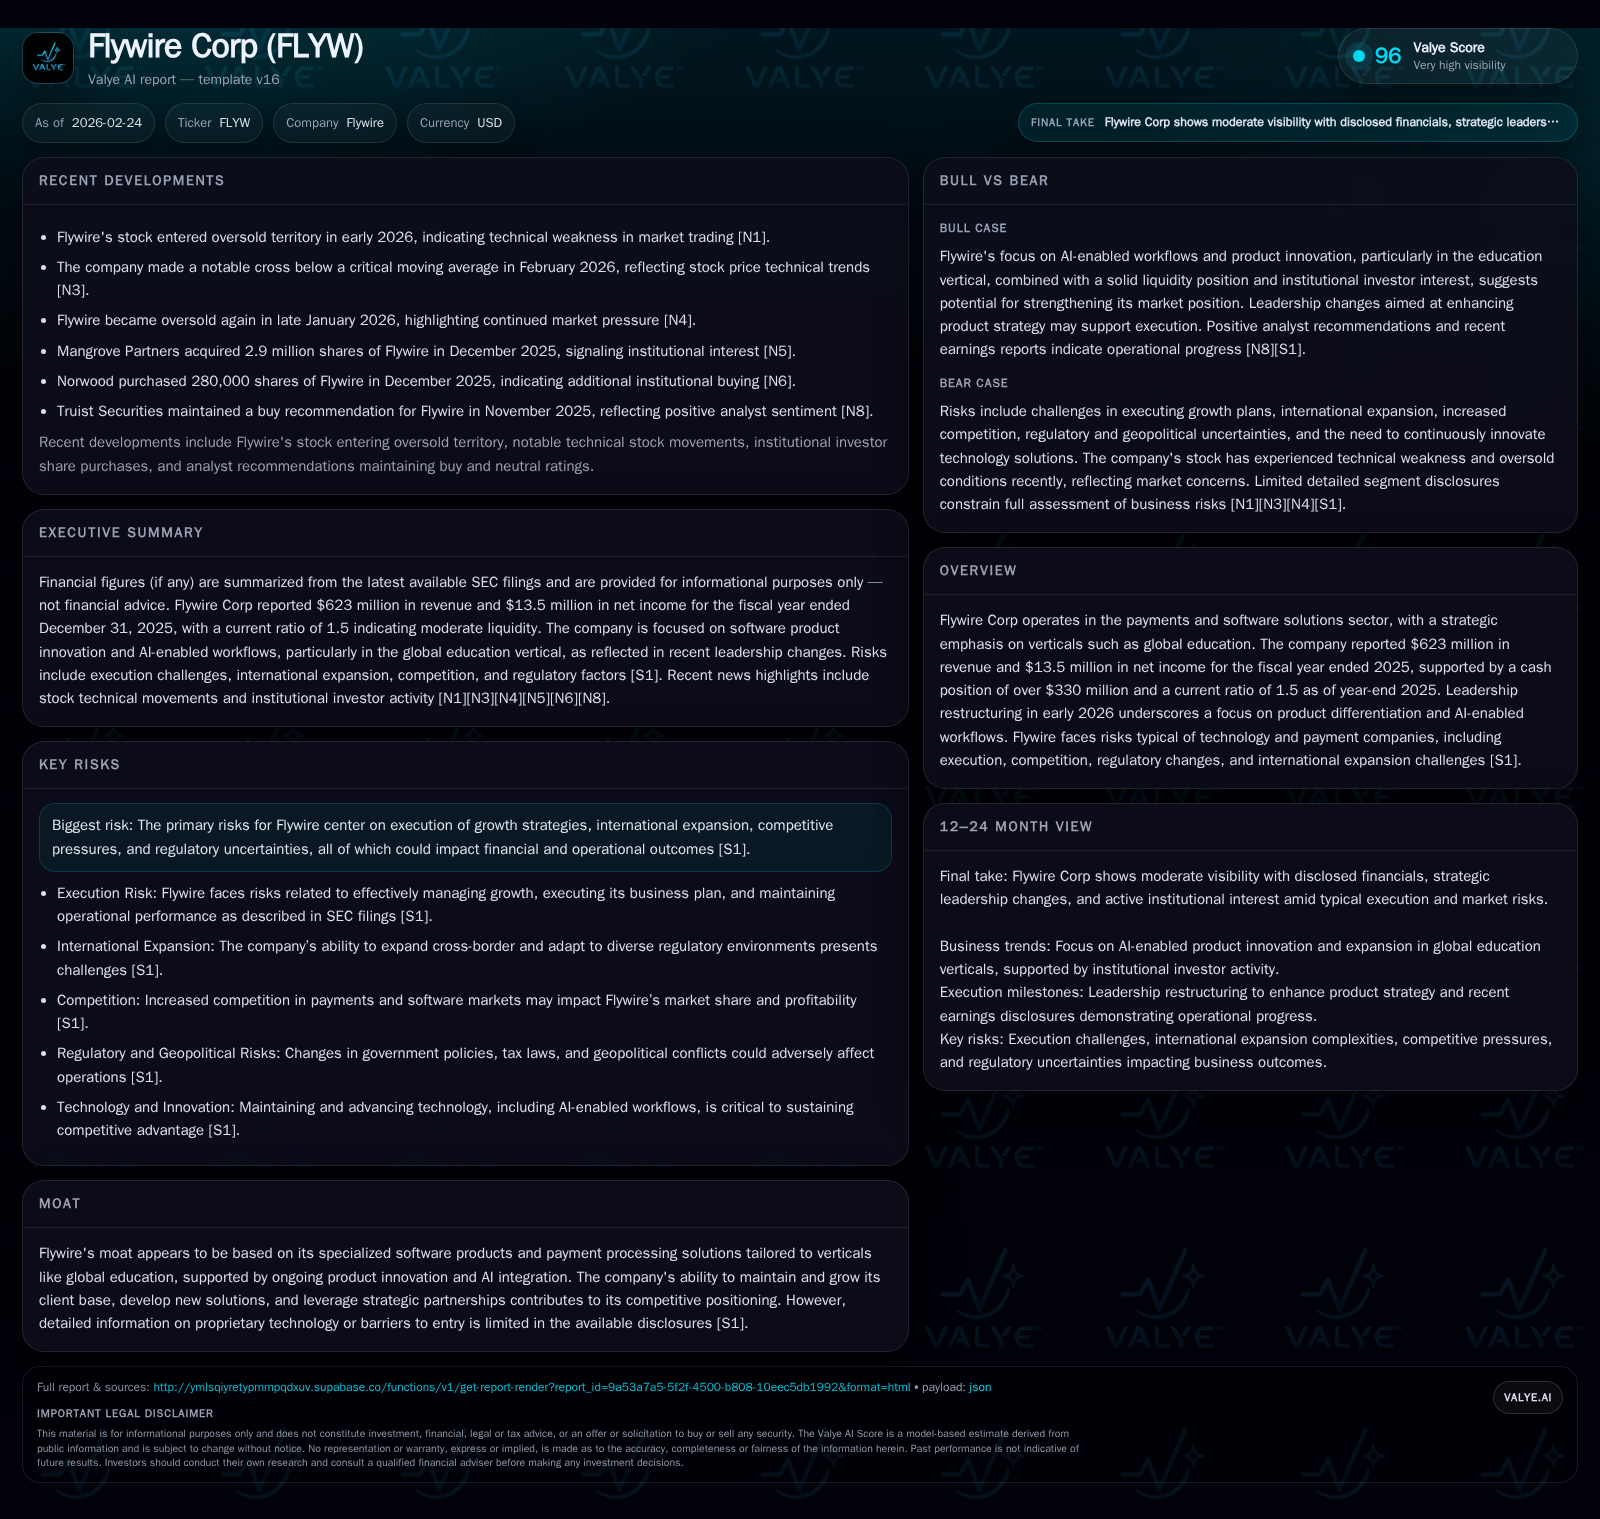
Flywire Corp (FLYW) demonstrated solid top-line expansion in fiscal 2025, achieving $623 million in revenue—a 26.6% increase year over year—and turned profitable with $13.5 million net income after several years of net losses. The company reports healthy cash flow generation and a sound liquidity position but faces ongoing risks related to international growth, competitive pressures, and regulatory complexities. Leadership restructuring in early 2026 underscores Flywire’s commitment to product differentiation and AI-enabled workflow integration, signaling its intent to solidify its vertical-specialized payments platform. Key near-term milestones include the appointment of a new CTO focused on platform scalability and reliability, alongside continued expansion in the global education vertical.
Historical Performance: Strong Growth Trajectory Amidst Early Losses
Flywire Corp has charted a compelling growth path over recent years as it expanded revenues from $289 million in FY2022 to over $623 million in FY2025 ([F1]). This represents a compound annual growth rate well above industry averages driven primarily by the company's focus on vertical-specific payment software solutions—especially global education, one of its core segments described in its disclosures [S1]. Year-over-year revenue jumped an impressive 26.6% from FY2024 to FY2025, while earlier years showed similar acceleration:
Historical performance (annual)
| FY | Rev ($mm) | Net ($mm) | CFO ($mm) | OpInc ($mm) | Rev YoY | Net YoY |
|---|---|---|---|---|---|---|
| 2025 | 623 | 13 | 100 | 11 | +26.6% | +365.4% |
| 2024 | 492 | 3 | 91 | -7 | +22.1% | +133.9% |
| 2023 | 403 | -9 | 81 | -22 | +39.3% | +78.2% |
| 2022 | 289 | -39 | 5 | -30 |
Note: Omitted columns lack sufficient annual XBRL coverage in the provided tags (need ≥2 annual points): Capex, Div, Buybacks. Source: SEC companyfacts cache [F1].
Capital returns and efficiency (annual)
| FY | FCF ($mm) | ROE% |
|---|---|---|
| 2025 | 99 | 1.6 |
| 2024 | 91 | 0.4 |
| 2023 | 80 | -1.1 |
| 2022 | -2 | -8.2 |
Source: SEC companyfacts cache [F1].
Note: Operating Income and Net Income YoY growth reflect turn from losses to profit.
Operational losses narrowed substantially year-over-year with Flywire generating operating income for the first time at approximately $11 million in FY2025 [F1]. Similarly, net income swung positive after multiple years of material net losses, reaching $13.5 million—driven by improved gross margins, scale efficiencies, and prudent expense management [S1]. Operating cash flows grew consistently from a negligible $5 million in FY2022 to nearly $100 million in FY2025 despite only modest capital expenditures (~$1–1.3 million annually), highlighting cash-generative strength alongside improving GAAP profitability [F1].
Equity holders have yet to receive dividends or share repurchases—consistent with late-stage growth tech companies—and Flywire appears prioritizing reinvestment into product innovation [F1][S29]. The company's equity base nearly doubled between FY2022 and FY2025, reflecting retained earnings growth combined with financing activity.
Future Growth Prospects: AI-Enabled Innovation and Vertical Expansion
Flywire emphasizes software-driven payment solutions tailored for specific verticals—most notably global education—with clear plans to deepen market penetration there as well as expand new sectors like business-to-business payments [S1]. The recent leadership evolution announced January–February 2026 signals a sharper focus on product differentiation powered by AI workflows ([S28][S16]). David King’s move from CTO to Chief Product Officer & Co-President underscores the importance placed on integrating education domain expertise with next-generation software strategy.
The appointment of Patrick Blanc as the new CTO effective February 23, 2026 marks a pivot toward deeper technical capability centered on platform reliability, scalability, and security—critical attributes for large-scale international payment processing platforms [S16]. This suggests Flywire is actively investing in technology infrastructure needed for sustained global footprint growth beyond core verticals.
Despite robust fundamentals and innovation thrusts, Flywire acknowledges multiple risk vectors that could constrain growth including intense sector competition from traditional payment processors and fintech entrants; operational execution risk inherent in cross-border expansion; exposure to evolving regulatory frameworks around payments, privacy, taxation, and compliance; and broader geopolitical uncertainties influencing client demand—especially relating to U.S. immigration policies affecting international students [S4][S12][S13].
Relevant Industry Context (Analysis):
Global payments platforms serving niche verticals increasingly rely on advanced data analytics and AI-driven automation for fraud detection, compliance monitoring, and transaction optimization—areas where Flywire is visibly investing resources per their stated strategy [S1][S16]. However, margin pressures remain common due to compliance cost inflation and competitive pricing dynamics.
Milestones and What To Watch
While specific forward-looking guidance remains unpublished at this stage [S25], investor communications highlight these key initiatives through mid-2026:
- Execution of CTO transition focusing on platform hardening.
- Enhancements in AI-enabled product suite rollout across verticals.
- Expansion pace within existing education clients plus onboarding of new high-value vertical customers.
- Managing liquidity prudently amid foreign exchange volatility impacting cross-border revenue recognition.
Monitoring quarterly filings will be essential for updates on these developments as they provide clarity on cadence towards targeted Adjusted EBITDA margin improvements and free cash flow amplification [S8][S10].
Returns & Capital Allocation: Cash Flow Strength Fuels Reinvestment Strategy
Flywire’s approximate return on equity stands around ~1.6% based on latest annual net income relative to equity balances—a reflection of early profitability phase rather than mature returns [F1]. Operating cash flow generation is robust with CFO exceeding $100 million recently while capital expenditures remain low relative to revenue scale supporting high free cash flow (near $99 million) [F1].
No dividends or share buybacks were reported in the available filings or data tags; thus capital allocation appears focused primarily on reinvestment into technology development including AI capabilities plus scaling operations internationally [F1][S29]. Liquidity metrics are solid with a current ratio near 1.5 supported by substantial cash reserves exceeding $330 million at fiscal year-end [F1]. This buffer allows flexibility amid intensifying competition and regulatory complexities.
Conclusion: Strategic Inflection Toward Scalability Amid Ongoing Execution Challenges
Flywire has transitioned impressively from a loss-making fintech startup into a growing payments software provider producing positive net income supported by strong operational cash flows as of FY2025. Its competitive edge lies in vertically focused platforms customized for complex payment needs—particularly within global education—augmented by emerging AI-driven workflows aiming at better UX and operational efficiency.
However, the company must navigate an intricate matrix of execution risk inherent in scaling internationally amidst tightening regulatory scrutiny worldwide while defending against competitive pressures prevalent in fintech payments markets. The recent management restructuring evidences proactive adjustments towards sustainable long-term positioning through enhanced product leadership allied with technical platform robustness.
From an analytical standpoint, tracking incremental margin expansion trends alongside customer diversification remote from single-industry concentration will be vital leading into subsequent reporting periods.
Disclaimer: This report is intended solely for informational purposes based on publicly disclosed data as of February 24, 2026 (including SEC filings [S#] and company facts [F1]) and does not constitute investment advice.
Disclaimer: This is research-only, informational analysis and not investment advice. It may include AI-generated interpretation and general industry context. Always verify important details using primary sources.
Comments